Automatically annotating a boxplot in matplotlib
You can probably tell from the sudden influx of matplotlib posts that I’ve been doing a lot of work plotting graphs recently…
I have produced a number of boxplots to compare different sets of data. Some of these graphs are for a non-technical audience, and my client agreed that a boxplot was the best way to visualise the data, but wanted the various elements of the boxplot to be labelled so the audience could work out how to interpret it.
I started doing this manually using the plt.annotate function, but quickly got fed up with manually positioning everything – so I wrote a quick function to do it for me.
If you just want the code then here it is – it’s not perfect, but it should be a good starting point for you:
def annotate_boxplot(bpdict, annotate_params=None,
                     x_offset=0.05, x_loc=0,
                     text_offset_x=35,
                     text_offset_y=20):
    """Annotates a matplotlib boxplot with labels marking various centile levels.

    Parameters:
    - bpdict: The dict returned from the matplotlib `boxplot` function. If you're using pandas you can
    get this dict by setting `return_type='dict'` when calling `df.boxplot()`.
    - annotate_params: Extra parameters for the plt.annotate function. The default setting uses standard arrows
    and offsets the text based on other parameters passed to the function
    - x_offset: The offset from the centre of the boxplot to place the heads of the arrows, in x axis
    units (normally just 0-n for n boxplots). Values between around -0.15 and 0.15 seem to work well
    - x_loc: The x axis location of the boxplot to annotate. Usually just the number of the boxplot, counting
    from the left and starting at zero.
    text_offset_x: The x offset from the arrow head location to place the associated text, in 'figure points' units
    text_offset_y: The y offset from the arrow head location to place the associated text, in 'figure points' units
    """
    if annotate_params is None:
        annotate_params = dict(xytext=(text_offset_x, text_offset_y), textcoords='offset points', arrowprops={'arrowstyle':'->'})

    plt.annotate('Median', (x_loc + 1 + x_offset, bpdict['medians'][x_loc].get_ydata()[0]), **annotate_params)
    plt.annotate('25%', (x_loc + 1 + x_offset, bpdict['boxes'][x_loc].get_ydata()[0]), **annotate_params)
    plt.annotate('75%', (x_loc + 1 + x_offset, bpdict['boxes'][x_loc].get_ydata()[2]), **annotate_params)
    plt.annotate('5%', (x_loc + 1 + x_offset, bpdict['caps'][x_loc*2].get_ydata()[0]), **annotate_params)
    plt.annotate('95%', (x_loc + 1 + x_offset, bpdict['caps'][(x_loc*2)+1].get_ydata()[0]), **annotate_params)
You can then run code like this:
df = pd.DataFrame({'Column 1': np.random.normal(size=100),
                   'Column 2': np.random.normal(scale=2, size=100)})

bpdict = df.boxplot(whis=[5, 95], return_type='dict')
annotate_boxplot(bpdict, x_loc=1)
This will produce something like this:
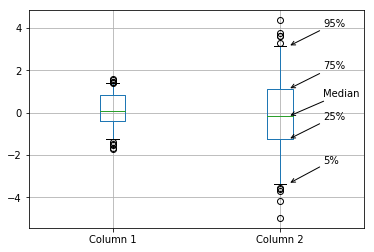
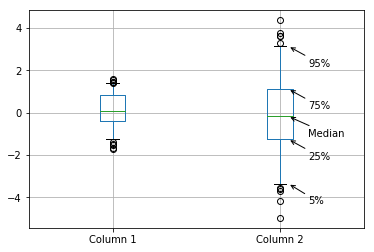
You can pass various parameters to change the display. For example, to make the labels closer to the boxplot and lower than the thing they’re pointing at, set the parameters as: text_offset_x=20 and text_offset_y=-20, giving:
So, how does this work? Well, when you create a boxplot, matplotlib very helpfully returns you a dict containing the matplotlib objects referring to each part of the boxplot: the box, the median line, the whiskers etc. It looks a bit like this:
{'boxes': [<matplotlib.lines.Line2D object at 0x1179db908>,
           <matplotlib.lines.Line2D object at 0x1176ac3c8>],
 'caps': [<matplotlib.lines.Line2D object at 0x117736668>,
          <matplotlib.lines.Line2D object at 0x1177369b0>,
          <matplotlib.lines.Line2D object at 0x1176acda0>,
          <matplotlib.lines.Line2D object at 0x1176ace80>],
 'fliers': [<matplotlib.lines.Line2D object at 0x117736dd8>,
            <matplotlib.lines.Line2D object at 0x1176b07b8>],
 'means': [],
 'medians': [<matplotlib.lines.Line2D object at 0x117736cf8>,
             <matplotlib.lines.Line2D object at 0x1176b0470>],
 'whiskers': [<matplotlib.lines.Line2D object at 0x11774ef98>,
              <matplotlib.lines.Line2D object at 0x117736320>,
              <matplotlib.lines.Line2D object at 0x1176ac710>,
              <matplotlib.lines.Line2D object at 0x1176aca58>]}
Each of these objects is a matplotlib.lines.Line2D object, which has a get_xdata() and get_ydata() method (see the docs for more details). In this case, all we’re interested in is the y locations, so get_ydata() suffices.
All we do then is grab the right co-ordinate from the list of co-ordinates that are returned (noting that for the box we have to look at the 0th and the 2nd co-ordinates to get the bottom and top of the box respectively). We also have to remember that the caps dict entry has two objects for each individual boxplot – as there are caps at the bottom and the top – so we have to be a bit careful with selecting those.
The other useful thing to point out is that you can choose what co-ordinate systems you use with the plt.annotate function – so you can set textcoords='offset points' and then set the same xytext value each time we call it – and all the labels will be offset from their arrowhead location the same amount. That saves us manually calculating a location for the text each time.
This function was gradually expanded to allow more configurability – and could be expanded a lot more, but should work as a good starting point for anyone wanting to do the same sort of thing. It depends on a lot of features of plt.annotate – for more details on how to use this function look at its documentation or the Advanced Annotation guide.
If you found this post useful, please consider buying me a coffee.
This post originally appeared on Robin's Blog.
Categorised as: Programming, Python
WAAH
Thank you a lot for your help! It’s wonderful
[…] Automatically annotating a boxplot in matplotlib […]