Easily specifying colours from the default colour cycle in matplotlib
Another quick matplotlib tip today: specifically, how easily specify colours from the standard matplotlib colour cycle.
A while back, when matplotlib overhauled their themes and colour schemes, they changed the default cycle of colours used for lines in matplotlib. Previously the first line was pure blue (color='b' in matplotlib syntax), then red, then green etc. They, very sensibly, changed this to a far nicer selection of colours.
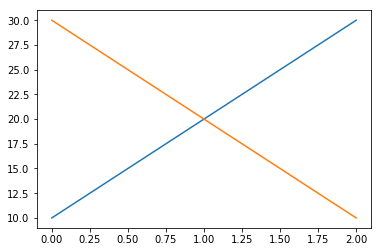
However, this change made one thing a bit more difficult – as I found recently. I had plotted a couple of simple lines:
x_values = [0, 1, 2]
line1 = np.array([10, 20, 30])
line2 = line1[::-1]

plt.plot(x_values, line1)
plt.plot(x_values, line2)
which gives
I then wanted to plot a shaded area around the second line (the yellow one) – for example, to show the uncertainty in that line.
You can do this with the plt.fill_between function, like this:
plt.fill_between(x_values, line2 - 5, line2 + 5, alpha=0.3, color='y')This produces a shaded line which extends from 5 below the line to 5 above the line:
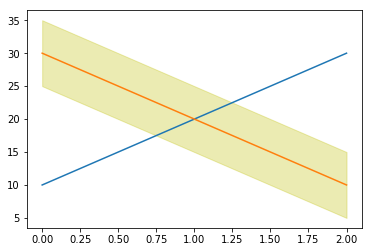
Unfortunately the colours don’t look quite right: the line isn’t yellow, so doing a partially-transparent yellow background doesn’t look quite right.
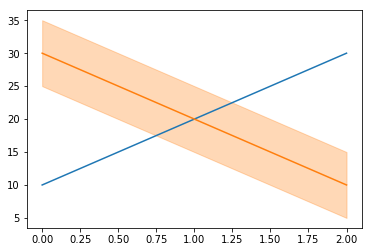
I spent a while looking into how to extract the colour of the line so I could use this for the shading, before finding a really easy way to do it. To get the colours in the default colour cycle you can simply use the strings 'C0', 'C1', 'C2' etc. So, in this case just
plt.fill_between(x_values, line2 - 5, line2 + 5, alpha=0.3, color='C1')The result looks far better now the colours match:
I found out about this from a wonderful graphical matplotlib cheatsheet created by Nicolas Rougier – I’d strongly suggest you check it out, there are all sorts of useful things on there that I never knew about!
Just in case you need to do this the manual way, then there are two fairly straightforward ways to get the colour of the second line.
The first is to get the default colour cycle from the matplotlib settings, and extract the relevant colour:
cycle_colors = plt.rcParams['axes.prop_cycle'].by_key()['color']which gives a list of colours like this:
['#1f77b4', '#ff7f0e', '#2ca02c', '#d62728', ...]You can then just use one of these colours in the call to plt.fill_between – for example:
plt.fill_between(x_values, line2 - 5, line2 + 5, alpha=0.3, color=cycle_colors[1])The other way is to actually extract the colour of the actual line you plotted, and then use that for the plt.fill_between call
x_values = [0, 1, 2]
line1 = np.array([10, 20, 30])
line2 = line1[::-1]

plt.plot(x_values, line1)
plotted_line = plt.plot(x_values, line2)
plt.fill_between(x_values, line2 - 5, line2 + 5, alpha=0.3, color=plotted_line[0].get_color())
Here we save the result of the plt.plot call when we plot the second line. This gives us a list of the Line2D objects that were created, and we then extract the first (and only) element and call the get_color() method to extract the colour.
I do freelance work in data science and data visualisation – including using matplotlib. If you’d like to work with me, have a look at my freelance website or email me.
If you found this post useful, please consider buying me a coffee.
This post originally appeared on Robin's Blog.
Categorised as: Programming, Python
Leave a Reply