How to: get nice vector graphics in your exported PDF ipython notebooks
(This is really Part 2 of IPython tips, tricks & notes – Part 1, but I thought I’d give it a more self-explanatory title)
IPython (sorry, Jupyter!) notebooks are really great for interactively exploring data, and then turning your analyses into something which can easily be sent to a non-technical colleague (by adding some Markdown and LaTeX cells along with the code and output graphs).
However, I’ve always been frustrated by the quality of the graphics that you get when you export a notebook to PDF. This simple example PDF was exported from a notebook and shows what I mean – and an enlarged screenshot is below:

You can see how blurry the text and lines are – it looks horrible!
Now, normally if I were producing graphs like this in matplotlib, I’d save the outputs as PDF, so I get nice vector graphics which can be enlarged as much as you want without any reduction in quality. However, I didn’t know how I could do that in the notebook while still allowing the plots to be displayed nicely inline while editing the notebook.
Luckily, at the NGCM Summer Academy IPython Training Course, I had the chance to ask one of the core IPython developers about this, and he showed me the method below, which works brilliantly.
All you have to do is add the following code to your notebook – but note, it must be after you have imported matplotlib. So, the top of your notebook would look something like this:
from matplotlib.pyplot import *
%matplotlib inline

from IPython.display import set_matplotlib_formats
set_matplotlib_formats('png', 'pdf')
This tells IPython to store the output of matplotlib figures as both PNG and PDF. If you look at the .ipynb file itself (which is just JSON), you’ll see that it has two ‘blobs’ – one for the PNG and one for the PDF. Then, when the notebook is displayed or converted to a file, the most useful format can be chosen – in this case, the PNG is used for interactive display in the notebook editor, and the PDF is used when converting to LaTeX.
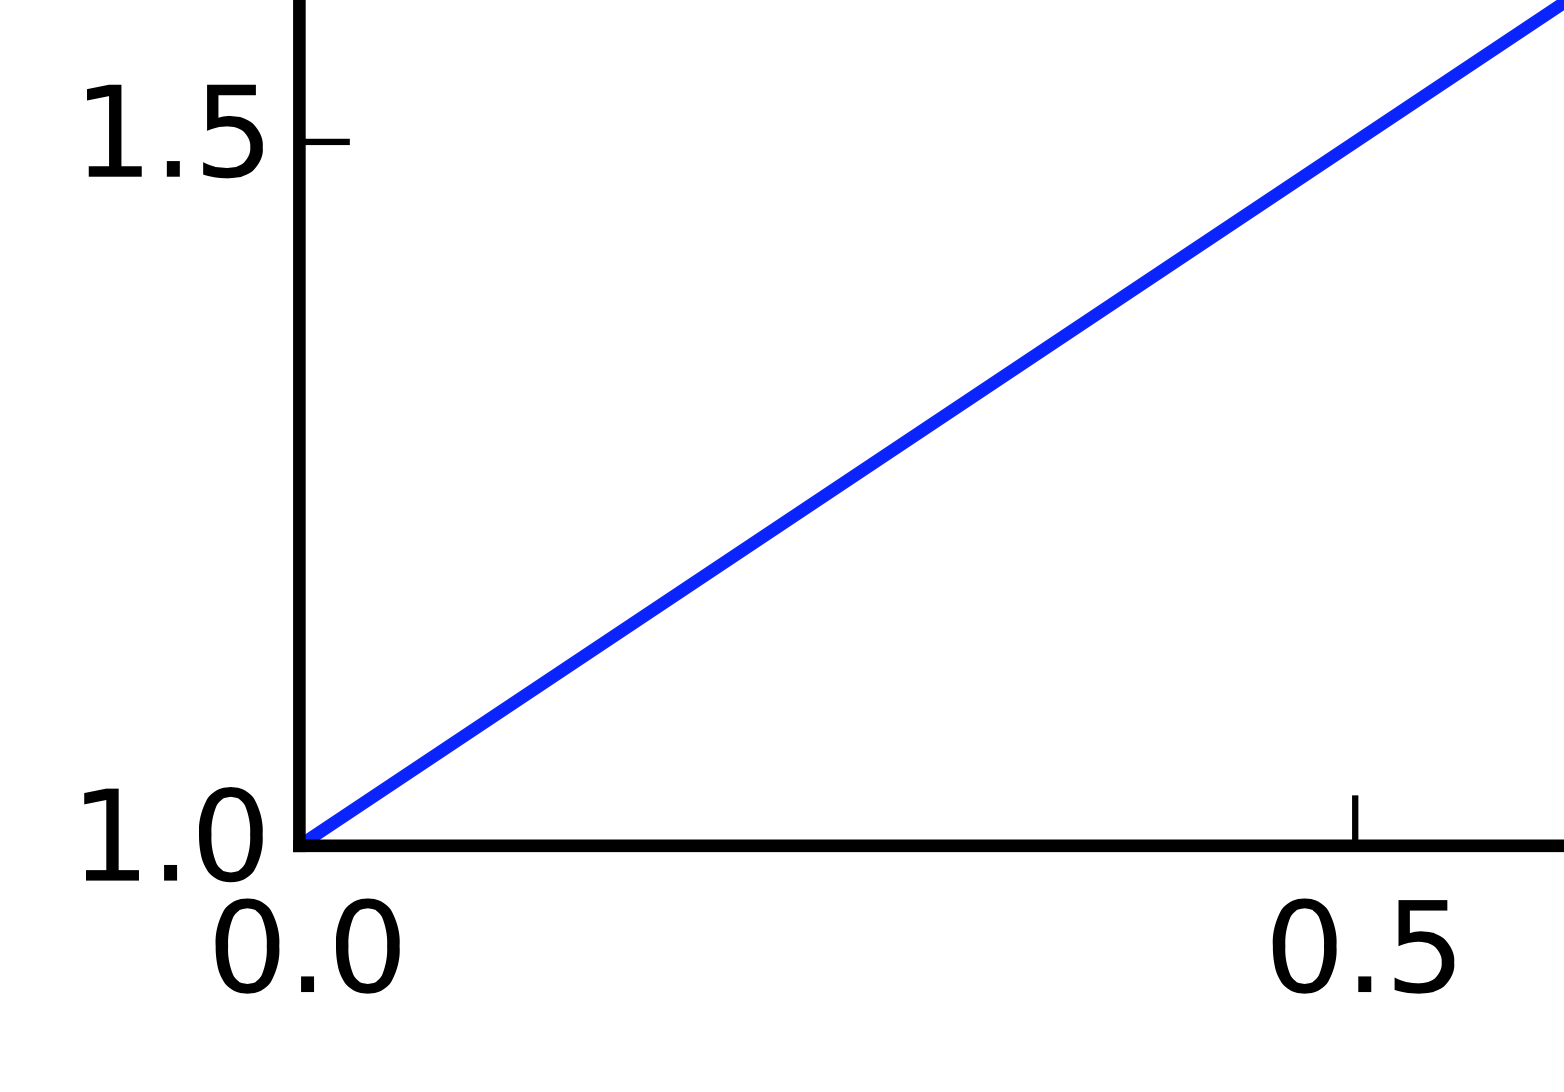
Once we’ve added those lines to the top of our file, the resulting PDF looks far better:
So, a simple solution to a problem that had been annoying me for ages – perfect!
If you found this post useful, please consider buying me a coffee.
This post originally appeared on Robin's Blog.
Categorised as: Computing, How To, Programming, Python
Amazing! thanks! 🙂
Hi
After trying these commands, the plots in my notebook are no more interactive…
How can I go back please ?
Oh, I’m not sure why that’s happened. However, you should be able to go back by simple restarting the notebook kernel (Kernel->Restart on the menu), and then deleting those commands from the top of the notebook and re-running the cells you need.
It seems that this is ok, but what do you think ?
import matplotlib as mpl
import matplotlib.pyplot as plt
inline_rc = dict(mpl.rcParams)
Sorry we posted same time, your suggestion did not worked for me
That’s really strange. All I can suggest is asking on an IPython support group (eg. on the mailing list, or on StackOverflow). The code in my article should only take effect for that specific Python session, so restarting the kernel and not running that code should take everything back to how it was before.
@Fred, try using “%matplotlib notebook” instead of “%matplotlib inline”
Thanks!
It works for pdf but not png 🙁