Matplotlib titles have configurable locations – and you can have more than one at once!
Just a quick post here to let you know about a matplotlib feature I’ve only just found out about.
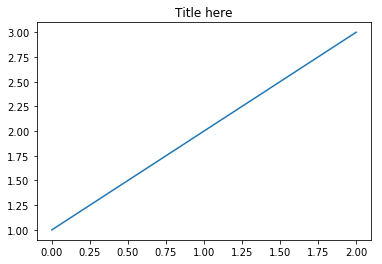
I expect most of my readers know how to produce a simple plot with a title using matplotlib:
plt.plot([1, 2, 3])
plt.title('Title here')
which gives this output:
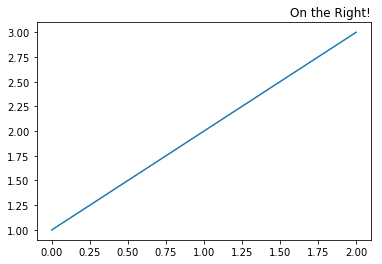
I spent a while today playing around with special code (using plt.annotate) to put some text on the right-hand side of the title line – but found it really difficult to get the text in just the right location…until I found that you can do this with the plt.title function:
plt.plot([1, 2, 3])
plt.title('On the Right!', loc='right')
giving this:
You can probably guess how to put a title on the left – yup, it’s loc='left'.
What makes things even better is that you can put multiple titles in different places:
plt.plot([1, 2, 3])
plt.title('Centre Title')
plt.title('RH title', loc='right')
plt.title('LH title', loc='left')
giving

I used this recently as part of some freelance work to produce graphs of air quality in Southampton. I had lots of graphs using data from different periods – one might be just for spring, or one just for early August – and I wanted to make it clear what date range was used for each graph. Putting the date range covered by each graph on the right-hand side of the title line made it very easy for the reader to see what data was used – and I did it with a simple bit of code like this:
plt.plot([1, 2, 3])
plt.title('Straight line graph')
plt.title('1st-5th June', loc='right', fontstyle='italic')
producing this:

(Note: you can pass arguments like fontstyle='italic' to any matplotlib function that produces text – things like title(), xlabel() and so on)
If you found this post useful, please consider buying me a coffee.
This post originally appeared on Robin's Blog.
Categorised as: Programming, Python
[…] This post explains how to create matplotlib titles in various locations. […]