How to: Log electricity usage from a CurrentCost EnviR – Part 2
At the end of my last post I left you with a taster of what Part 2 would provide: a way of producing automatically-updating graphs of power usage over time. Part 1 was based purely on Python code that would run on any system (Windows, Linux or OS X) but this part will require a Linux machine running a tool called graphite. Don’t worry, it’s nice and easy to set up, and I’ll take you through it below.
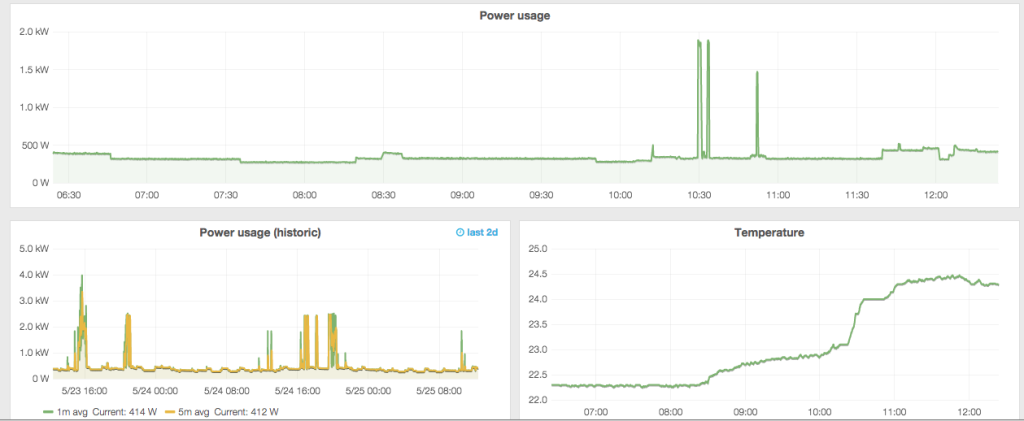
In summary, we are going to set up Graphite, a tool for storing time series data with automatic aggregation to different resolutions, and then write a small daemon in Python to automatically push the power usage data from the CurrentCost to Graphite. Finally, we’ll set up a nicer web interface to Graphite that will give us graphs like this:
(For those who are familiar with it, Graphite is very similar to rrdtool, but – in my humble opinion – a bit nicer to use and more ‘modern-feeling’)
Step 1: Install Graphite
I basically followed the DigitalOcean instructions here, but modified them slightly to my needs. So, read that link for all of the details, but on Ubuntu that is what I did:
-
Install graphite:
sudo apt-get update

sudo apt-get install graphite-web graphite-carbon -
Modify
/etc/graphite/local_settings.py
Set the key configuration parameters:SECRET_KEY,TIME_ZONE,USE_REMOTE_USER_AUTHENTICATION -
Create the database structure
sudo graphite-manage syncdb
-
Modify
/etc/default/graphite-carbon
SetCARBON_CACHE_ENABLED=true -
Modify
/etc/carbon/storage-schemas.conf
This file allows you to configure the ‘storage schemas’ in Graphite that control how aggregation works. This is key to efficient use of Graphite, and it’s worth getting the right schema set up from the start.The storage schema defines what resolution data is stored for what period of time. For example, have a look at the
[default]section at the end of the file. Thepatternsection specifies a regular expression to match the name of ametricin Graphite. A metric is simply something you’re measuring – in this case we will have two metrics: power usage and temperature, as these are the two interesting things that the CurrentCost measures.Graphite works down this file from top to bottom, stopping when it finds a match. So, in the
[default]section we have a pattern that matches anything – as by the time it gets to this final section we want it to match anything. Theretentionssection is the interesting bit: here it states60s:1d, which means to keep data at a 60-second resolution (that is, one data point per minute) for 1 day. Graphite will deal with ensuring that this is the case – aggregating any data that is pushed to Graphite more frequently than once per minute, and removing data that is older than one day.A more complicated example of a retention string would be
10s:6h,1m:30d,10m:5y,30m:50y, which instructs Graphite to keep data at 10s resolution for 6 hours, 1m resolution for 30 days, 10 minute resolution for 5 years and 30 minute resolution for 50 years. Again, graphite will deal with the resampling that is needed, and this will mean that your detailed 10s-resolution data won’t be kept for 50 years.I created the following two new entries to store data from my CurrentCost:
[powerusage]

pattern = ^house.power.usage

retentions = 10s:6h,1m:30d,10m:5y,30m:50y
[powertemperature]

pattern = ^house.power.temperature

retentions = 1m:30d,5m:1y,10m:5y,30m:50y
You can see here that I am storing the temperature data at a lower resolution than the power usage data: I will probably want to play around turning appliances on and off in my house to see the effect on the power usage – so I’ll need a high resolution – but I’m unlikely to need that with the temperature. Also note the names that I gave the metrics: it is considered standard to split the name by .’s and work downwards in specificity. I might use this Graphite install for monitoring more metrics about my house, so I’ve decided to use
houseas an over-arching namespace and thenpowerfor everything to do with power monitoring. -
Start the carbon service:
sudo service carbon-cache startSetting up the Graphite web interface
Right, you’ve got the basic Graphite system installed: we now just need to set up the web interface. Here I’m going to point you to the Install and Configure Apache section of the DigitalOcean instructions, as it’s a bit too detailed to repeat here. However, just for reference, the content of my virtual host file is here – I had to fiddle around a bit to get it to run on port 81 (as I already had things running on port 80), but using this file plus adding:
Listen 81
NameVirtualHost *:81
to /etc/apache2/ports.conf made it all work happily.
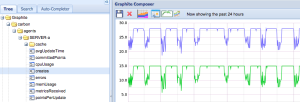
Once you’ve got all of the Apache stuff sorted you should be able to go to http://servername or http://ipaddress (if you’re running this on your local machine then http://127.0.0.1 should work fine) and see the Graphite user interface. Expand the Graphite item in the tree view on the left-hand side, and work your way down until you find the carbon metrics: these are automatically recorded metrics on how the Graphite system itself is working. Clicking on a few metrics should plot them on a graph – and you should see something a bit like this (probably with less interesting lines as your server isn’t doing much at this point):
Step 2: Get CurrentCost data into Graphite
If you’re bored you can just grab the code from this Github repository, but I’m going to take you through it step-by-step here.
Basically, every time you send data to Graphite you need to tell it what metric you’re sending data for (eg. home.power.usage), the value (eg. 436) and the current timestamp. Luckily there’s a Python module that makes this really easy. It’s called graphitesend, and it’s got really good documentation too!
You should be able to install it by running pip install graphitesend, and then you can try running some code. To test it, load up the interactive Python console and run this:
import graphitesend

graphitesend.init(graphite_server='localhost',
                  system_name='', group='power',
                  prefix='house')
graphitesend.send_dict({'temperature':21.5, 'usage':300})
Simple, isn’t it! All we do is initialise the client by giving it the name of the graphite server, and a few configuration options to say what group and prefix we’re going use for the metrics, and then send a dictionary of data.
So, it’s really easy to hook this up to the Python code that I showed in Part 1 that grabs this data from the CurrentCost.
I’ve put these two pieces of code together, and turned the script into a daemon: that is, a program that will stay running all of the time, and will send data to Graphite every 5 seconds or so. All of the code is in the Github repository, and is fairly simple – it uses the python-daemon library to easily run as a ‘well-behaved’ unix daemon. Remember to install this library first with pip install python-daemon.
All you should need to do is grab the code from Github, and then run ./currentcost_daemon.py start to start the daemon and (surprise surprise) ./currentcost_daemon.py stop to stop the daemon. Simple!
Step 4: View the data
Once you’ve got the daemon running you should be able to refresh the Graphite web interface and then drill down in the tree on the left-hand side to house->power->usage, and see a graph of the data. You can experiment with the various items in the Graphite web interface, but if you’re like me then you won’t like the interface much!
Luckily, there are all sorts of other interfaces to Graphite, including a lovely one called Grafana. Again, it is very well documented, so all I’m going to do is point you to the installation instructions and leave you to it. Without much effort you should be able to produce a power dashboard that looks something like this:
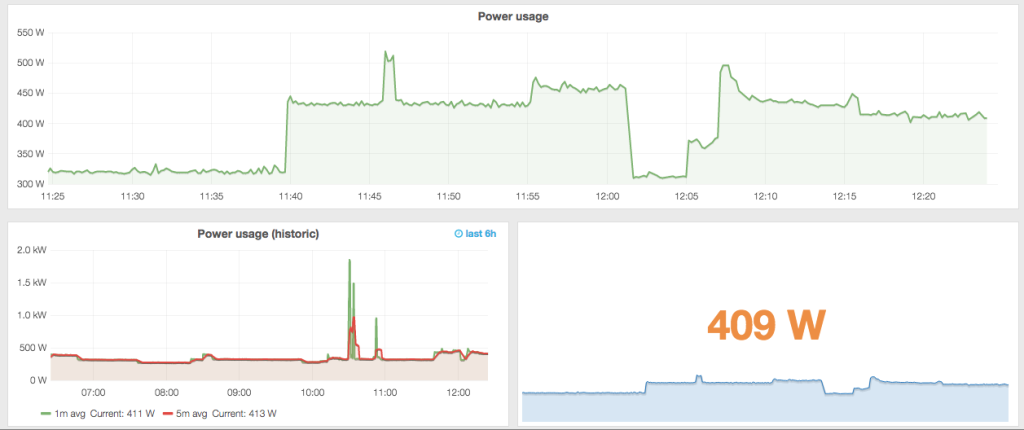
Or even this (with some averages and colour-coded numbers):
If you found this post useful, please consider buying me a coffee.
This post originally appeared on Robin's Blog.
Categorised as: Computing, Home Automation, How To, Linux, Programming, Python


Leave a Reply