Aeolian Philosophy or “What is a sand dune?”
No, this isn’t about thinking deeply while the wind is blowing, or philosophising about how the wind is there but we can’t see it – it’s about sand dunes.
Now, you might think that sand dunes are quite boring things, just hills made out of sand that sit there and do nothing. That couldn’t be further from the truth. As I learnt in my Aeolian Geomorphology and Geomorphic Modelling course, sand dunes are complex, dynamic systems which do interesting things like move, merge, split, and even automatically organise themselves.
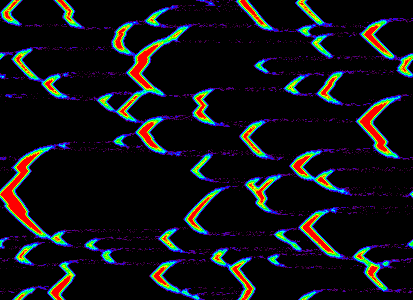
I’m doing some research on the self-organisation of sand dunes with Dr Jo Nield, and part of this research involves writing some software to automatically extract the crests of dunes from Digital Elevation Models (DEMs) showing an area of dunes (known as a dunefield), an example of which is shown in the image below), so that pattern metrics (statistics on the organisation of the dunes within the dune field) can be calculated. These DEMs are produced by a computer model which simulates dune field development. This software is being actively developed at the moment, and is available at my Dunes GIS page.
The issue that I want to write about today is the question what is a sand dune? It turns out that this question, which seems remarkably abstract, becomes very important when trying to write software to extract dune crests automatically – because to extract the crests of dunes you need to work out what is a dune and what isn’t! In fact, this problem often occurs when trying to write computer software to automate tasks that humans can do easily by hand. Academics who are manually tracing the crests of dunes from images on a computer screen have a large body of knowledge they can draw on to decide what is and isn’t a sand dune. Trying to program this knowledge into a computer is difficult, partly because it is often difficult to work out exactly what this body of knowledge contains.
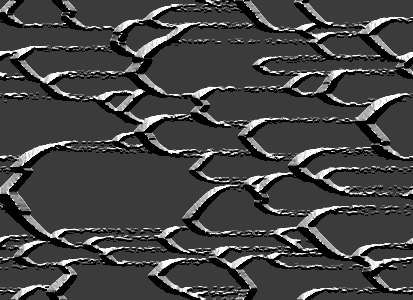
If a human were to try to trace the crests of the dunes shown in the image above then he would struggle, as the image doesn’t show the crests of the dunes very clearly. In fact, the majority of the middle of the dune is shown as a single colour (bright red) – so it is difficult to tell where the actual crest is. Therefore, a sensible analyst would transform the image to look something like the image below.
This transformation can be accomplished with one command in most image analysis software (if you’re interested I produced the above image in ENVI using the Topographic -> Topographic Modelling command) and shades the image so that it looks like a sun is shining on it from a certain direction. This makes the image look more ‘lifelike’, producing an image which is similar to the view you would get from an aircraft with the sun low in the sky) and therefore easier to interpret. The crests of the dunes can easily be seen, and therefore can be traced with a high accuracy.
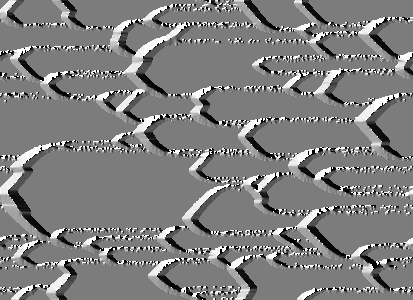
When implementing my automated method for tracing dunes I attempted to mirror the approach a human would use. Instead of using a shaded relief version of the DEM I used a similar version in which the values of each cell have a real-world meaning: the aspect map (shown below). Creating this image involves a simple process where each cell is assigned the direction that the slope of that cell faces (that is, its aspect) in degrees.
As you can see, it is relatively easy to see where the dune crests are on this image. Therefore, it is relatively simple to write an algorithm to extract the dunes, by looking for the changes in colour on the image above (which are represented quantitatively by the shifting of the aspect value from less than 180 degrees to greater than 180 degrees).
However, this leads to a very messy set of crest lines, as much of the noise in the image is identified as a separate dune. When a human starts to trace dunes from this image their eye will be automatically drawn to some of the large dunes, and they will, almost subconsciously, ignore much of the noise which is visible in the image. A computer won’t do this, so therefore a number of filtering processes are used to both remove the noise before the image is processed, and remove the crests of ‘invalid’ dunes (for example, extremely short dunes) after the crests have been extracted.
But now the big question: are these crests that have been extracted actually the crests of real dunes? If we’re going to use this automated method to get statistics which can be used to develop scientific theories about the behaviour of sand dunes, then we’d better be pretty sure that the crests we’ve extracted actually belong to real dunes!
So, this all leads back to the question what is a sand dune? The answer, unsurprisingly, is not simple. I haven’t yet investigated all of the literature, but I remember learning in my aeolian geomorphology course that most models of dune formation require the dune to have three key characteristics before they can be said to be fully-developed sand dunes:
- A gently sloping windward slope
- A steeply sloping lee slope
- Fully-developed grainflow and grainfall processes leading to dune movement
Note that the definition above mentions neither the existence of crests nor a minimum length for dunes. The existence of crests can be inferred from characteristics 1 and 2, as if these are present then there will be a crest. However, the presence of a crest does not necessarily mean that one slope is gentle and the other is steep. Also, the processes of dune movement are not, and in fact cannot, be identified from a single DEM. Therefore, it could be said that the existence of a crest is a necessary condition but not a sufficient condition for a dune to exist.
It can be seen from the above that the question what is a dune? is most definitely important when studying dunes, and also very difficult to answer. It also shows the limitations of using imperfect data to study the natural world. With access to the right data dunes could be identified with a very high confidence, but sadly this data is frequently unavailable. Therefore, information derived from imperfect data, using methods with unavoidable problems, is often used to develop scientific theories. This is obviously a problem, but is sadly often (or maybe always?) unavoidable.
If you found this post useful, please consider buying me a coffee.
This post originally appeared on Robin's Blog.
Categorised as: Academic, GIS, Remote Sensing, TOK-related


Hi! This is the girl from Headington who asked that question at the end of your talk (which we all found interesting btw!) The lesson after when we were talking about the accumulation of scientific knowledge, I suggested the ‘Adjacent Possible’ (which I learnt of from an unrelated YouTube video about career choice). I went home to look it up in a better context for TOK and found the phrase was coined by a guy called Kauffman and found out he used it to explain the biosphere in relation to self-organisation and emergent properties! So I thought I’d ask if you’ve heard of him (https://edge.org/conversation/stuart_a_kauffman-the-adjacent-possible) and also that it might be of interest to you. So thanks again for the talk! It was a big help for my TOK essay since it meant I could also expand on the adjacent possible using those ideas 🙂