Simple segmentation of geospatial images
I had a need to do some segmentation of some satellite imagery the other day, for a client. Years ago I was quite experienced at doing segmentation and classification using eCognition but that was using the university’s license, and I don’t have a license myself (and they’re very expensive). So, I wanted a free solution.
First, however, let’s talk a little bit about what segmentation is (thanks to Sonya in the comments for pointing out that I didn’t cover this!). Segmentation is a way of splitting an image up into groups of adjacent pixels (‘segments’ or ‘objects’) that ‘look right’ and, ideally, represent objects in the image. For example, an image of cells from a microscope might be segmented into individual cells, or individual organelles inside the cell (depending on the scale), a satellite image might be segmented into fields, clumps of urban area or individual buildings/swimming pools/driveways – again, depending on the scale. Segmentation uses properties of the image (like colour, texture, sharp lines etc) to try and identify these segments.
Once you’ve segmented an image, you can then do things with the segments – for example, you can classify each segment into a different category (building, road, garden, lake). This is often easier than classifying individual pixels, as you have group statistics about the segment (not just ‘value in the red band’, but a whole histogram of values in the red band, plus mean, median, max etc, plus texture measures and more). Sometimes you may want to use the segment outlines themselves as part of your output (eg. as building outlines), other times they are just used as a way of doing something else (like classification). This whole approach to image processing is often known as Object-based Image Analysis.
There are various segmentation tools in the scikit-image library, but I’ve often struggled using them on satellite or aerial imagery – the algorithms seem better suited to images with a clear foreground and background.
Luckily, I remembered RSGISLib – a very comprehensive library of remote sensing and GIS functions. I last used it many years ago, when most of the documentation was for using it from C++, and installation was a pain. I’m very pleased to say that installation is nice and easy now, and all of the examples are in Python.
So, doing segmentation – using an algorithm specifically designed for segmenting satellite/aerial images – is actually really easy now. Here’s how:
First, install RSGISLib. By far the easiest way is to use conda, but there is further documentation on other installation methods, and there are Docker containers available.
conda install -c conda-forge rsgislibThen it’s a simple matter of calling the relevant function from Python. The documentation shows the segmentation functions available, and the one you’re most likely to want to use is the Shepherd segmentation algorithm, which is described in this paper). So, to call it, run something like this:
from rsgislib.segmentation.shepherdseg import run_shepherd_segmentation

run_shepherd_segmentation(input_image, output_seg_image,
                          gdalformat=’GTiff’,
                          calc_stats=False,
                          num_clusters=20,
                          min_n_pxls=300)
The parameters are fairly self-explanatory – it will take the input_image filename (any GDAL-supported format will work), produce an output in output_seg_image filename in the gdalformat given. The calc_stats parameter is important if you’re using a format like GeoTIFF, or any format that doesn’t support a Raster Attribute Table (these are mostly supported by somewhat more unusual formats like KEA). You’ll need to set it to False if your format doesn’t support RATs – and I found that if I forgot to set it to false then the script crashed when trying to write stats.
The final two parameters control how the segmentation algorithm itself works. I’ll leave you to read the paper to find out the details, but the names are fairly self-explanatory.
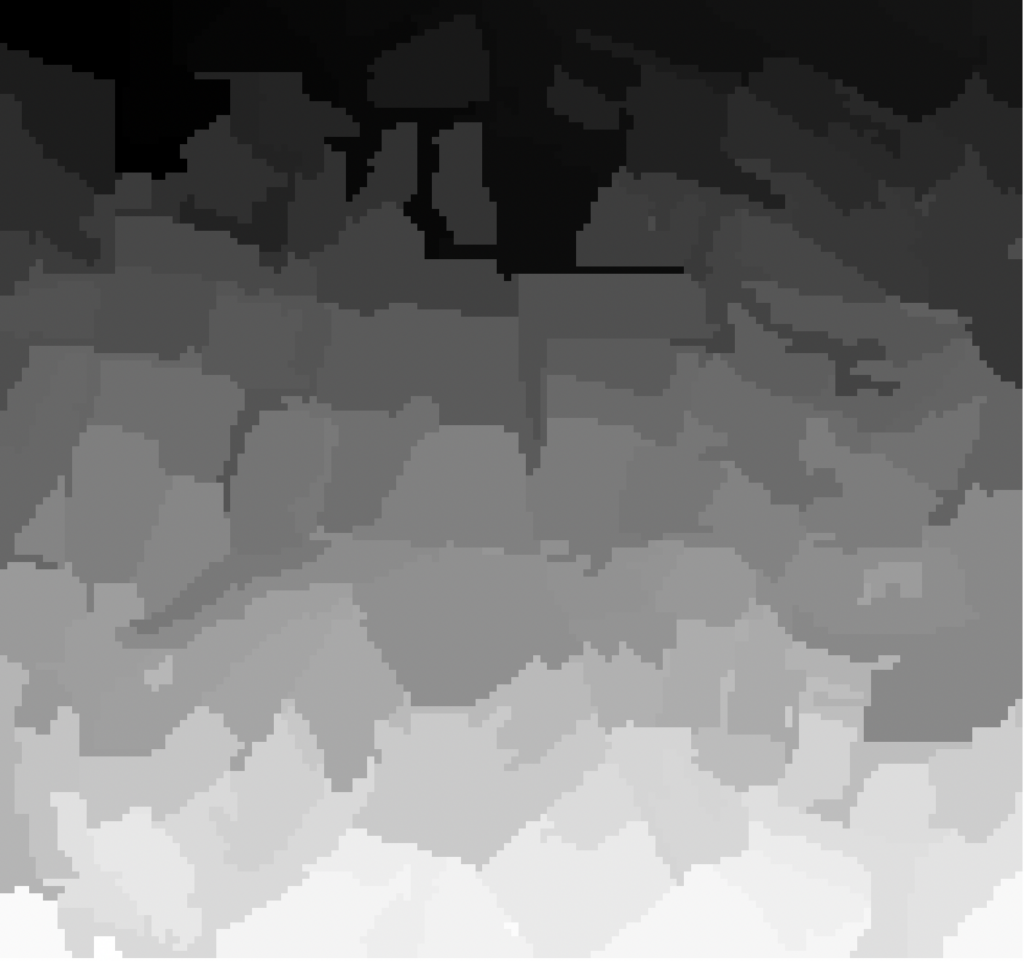
The output of the algorithm will look something like this:

It’s a raster where the value of all the pixels in the first segment are 1, the pixels in the second segment are 2, and so on. The image above uses a greyscale ‘black to white’ colormap, so as the values of the segments increase towards the bottom of the image, they show as more white.
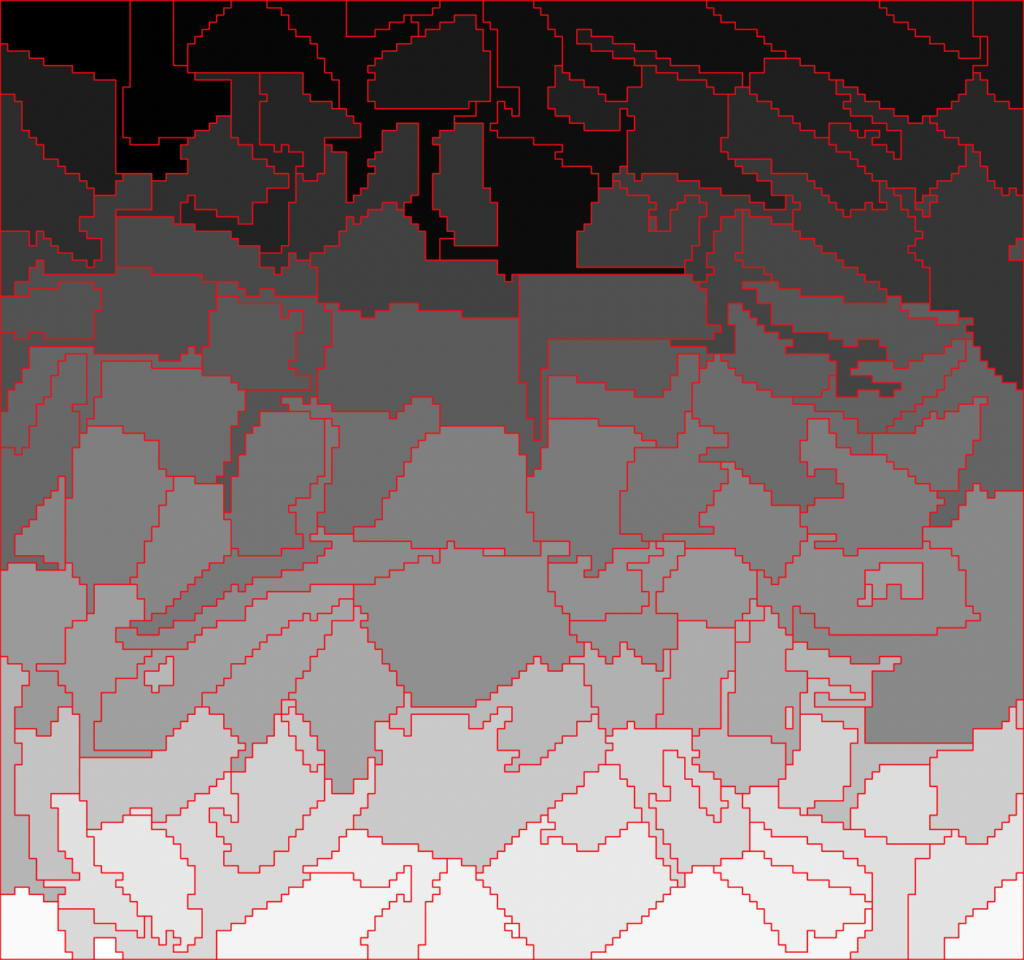
You can convert this raster output to a set of vector polygons, one for each segment, by using any standard raster to vector ‘polygonize’ algorithm. The easiest is probably using GDAL, by running a command like:
gdal_polygonize.py SegRaster.tif SegVector.gpkgThis will give you a result that looks like the red lines on this image:
So, there’s a simple way of doing satellite image segmentation in Python. I hope it was useful.
If you found this post useful, please consider buying me a coffee.
This post originally appeared on Robin's Blog.
Categorised as: Academic, GIS, How To, Programming, Python, Remote Sensing

What might you use segmentation for?
Ah yeah, I didn’t really mention that there. Oops!
Segmentation is a way of splitting an image up into clumps of pixels (‘segments’ or ‘objects’) that ‘look right’ (weird definition, but the best I could think of). For example, an image of cells from a microscope might be segmented into individual cells, or individual organelles inside the cell (depending on the scale), a satellite image might be segmented into fields, clumps of urban area or individual buildings/swimming pools/driveways – again, depending on the scale. Segmentation uses properties of the image (like colour, texture, sharp lines etc) to try and identify these segments. Once you’ve segmented an image, you can then do things with the segments – for example, you can classify each segment into a different category (building, road, garden, lake) – this is often easier than classifying individual pixels as you have group statistics about the segment (not just ‘value in the red band’, but a whole histogram of values in the red band, plus mean, median, max etc, plus texture measures and more). This whole approach to image processing is often known as Object-based Image Analysis.
(I think now I’ve written this, I might add it to the article too!)
Great explanation, thank you. Could be useful for identifying barriers to wheelchair users along paths, from aerial images, for example?
Yes, potentially. You’d need quite high-resolution aerial imagery to do that though. There are also ways of doing non-traditional object-based image analysis, and only creating objects in specific areas or for specific types of things (I did some of that in my PhD work, for instance).
Please could we see the image you input into the algorithm? Many thanks 🙂
[…] https://blog.rtwilson.com/simple-segmentation-of-geospatial-images/ […]