A load of links…
For months now I’ve been collecting a load of links saying that I’ll get round to blogging them "soon". Well, I’m currently babysitting for a friend’s daughter (who is sleeping peacefully upstairs), so I’ve finally found time to write them up.
So, here are a load of links – a lot of them are geospatial- or data-related, but I hope you might find something here you like even if those aren’t your specialisms:
- QGIS Visual Changelog for v3.36 – QGIS is great GIS software that I use a lot in my work. The reason this link is here though is because of their ‘visual changelog’ that they write for every new version – it is a really good way of showing what has changed in a GUI application, and does a great job of advertising the new features.
- List of unusual units of measurement – a fascinating list from Wikipedia. I think my favourite are the barn (and outhouse/shed) and the shake – you’ll have to read the article to see what these are!
- List of humourous units of measurement – linked from the above is this list of humourous units of measurement, including the ‘beard-second’, and the Smoot.
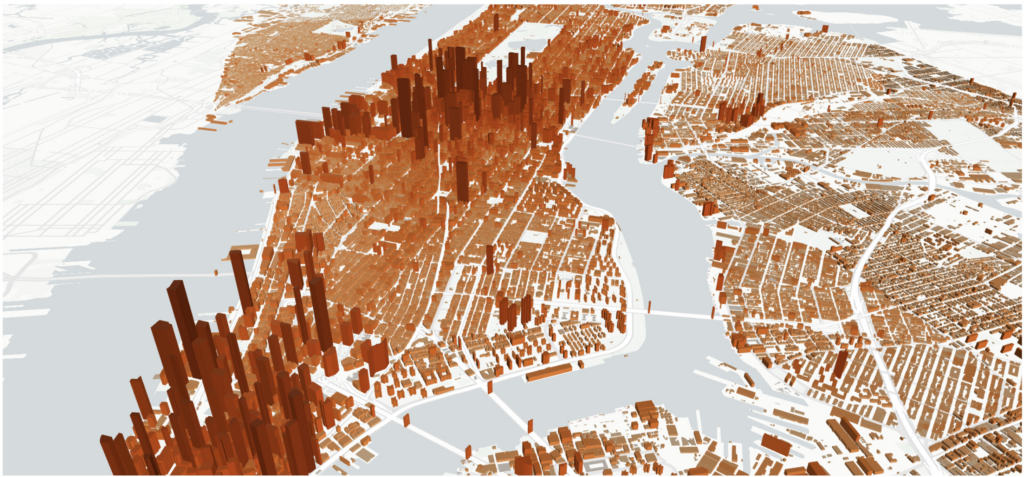
- lonboard – a relatively new package for very efficiently creating interactive webmaps of geospatial data from Python. It is so much faster than
geopandas.explore(), and is developing at a rapid pace. I’m using it a lot these days.

- A new metric for measuring learning – an interesting post from Greg Wilson about the time it takes learners to realise that something was worth learning. I wonder what the values are for some things that I do a lot of – remote sensing, GIS, Python, cloud computing, cloud-native geospatial etc.
- The first global 30-m land-cover dynamic monitoring product with fine classification system from 1985 to 2022 – an interesting dataset that I haven’t had chance to investigate in detail yet, but purports to give 30m global land cover every 5 years from 1985 and every year from 2000.
- CyberChef – from GCHQ (yes, the UK signals intelligence agency) comes this very useful web-based tool for converting data formats, extracting data, doing basic image processing, extracting files and more. You can even build multiple tools into a ‘recipe’ or pipeline.
- envreport – a simple Python script to report lots of information about the Python environment in a diffable form – I can see this being very useful
- Antarctic glaciers named after satellites – seven Antarctic glaciers have been named after satellites, reflecting (ha!) the importance of satellites in monitoring Antarctica
- MoMAColors and MetBrewer – these are color palettes derived from artwork at the Museum of Modern Art and the Metropolitan Museum of Art in New York. There are some beautiful sets of colours in here (see below) which I want to use in some future data visualisations.
- geospatial-cli – a list of geospatial command-line tools. Lots of them I knew, but there were some gems I hadn’t come across before here too.
- map-gl-tools – a nice Javascript package to add a load of syntactic sugar to the MapLibreJS library. I’ve recently started using this library and found things quite clunky (coming from a Leaflet background) so this really helped
- CoolWalks – a nice research paper looking at creating walking routes on the shaded side of the street for various cities
- Writing efficient code for GeoPandas and Shapely in 2023 – a very useful notebook showing how to do things efficiently in GeoPandas in 2023. There are a load of old ways of doing things which are no longer the most efficient!
- Inside PostGIS: Calculating Distance – a post explaining how PostGIS’s distance calculation algorithms work
- quackosm – a Python and CLI tool for reading OpenStreetMap data using DuckDB – either for future analysis in DuckDB or for export to GeoParquet
- Comparing odc.stac.load and stackstac for raster composite workflow – fairly self-explanatory, but it’s interesting to see the differences between two widely-used tools in the STAC ecosystem
- Towards Flexible Data Schemas – this article shows how the flexibility of data schemes in specifications like STAC really help their adoption and use for diverse purposes
If you found this post useful, please consider buying me a coffee.
This post originally appeared on Robin's Blog.
Categorised as: Academic, Computing, GIS, Linux, OSX, Programming, Python, Remote Sensing, Windows

[…] did a post a while back which was just a lot of links to things I found interesting, mostly in the […]