Roadside leafiness from space – Part 2
In the last post in this series, I showed some pretty maps of roadside leafiness, created by extracting NDVI values near roads – like this:

This time, I want to move away from pretty images to some numerical analysis – and also move from a local scale to a national scale.
My first question was: which is the leafiest place in the country?
Now, that question requires a bit of refining – firstly to work out what we mean by a "place". If we look in the countryside then we’re going to find very leafy roads – so we need to restrict this to urban areas. Luckily, the Office for National Statistics have produced a dataset that helps us here: the Built-Up Areas Boundary dataset. This data, from 2011, is automatically created from Ordnance Survey data, and consists of vector outlines of built-up areas in England. We can take these polygons and extract the average leafiness in each polygon and produce a map like this:

You can see here that lots of built-up areas are present, including many very small areas. You can also see that some areas are very large – built-up areas within a certain distance of each other are merged, which creates a ‘South Hampshire Built-Up Area’ which includes Southampton, Eastleigh, Chandlers Ford, Fareham, Gosport, Portsmouth and more. It’s rather frustrating from the perspective of our analysis, but I suppose it shows how built-up this area of South Hampshire is.
We can go ahead and export this aggregated leafiness data to CSV (I chose to aggregate using mean and median to compare them) to continue the analysis in Python. If you want to see how I analysed the CSV data then have a look at this notebook – but it’s fairly simple pandas analysis, and the main results are reproduced here.
So – which are the leafiest places in the country?
| Name | Leafiness |
| Winchester | 0.23 |
| Northwich | 0.18 |
| Maidenhead | 0.18 |
| Heswall | 0.17 |
| Worcester | 0.16 |
You can see that Winchester comes out top by a fair way. Winchester is probably the only one of these that I would have immediately thought of as very leafy – but that probably says more about my preconceptions than anything else. These were calculated using mean leafiness, but the top four stay the same, and the fifth entry is Great Malvern. I think that is likely an anomaly as the built-up area outline for Great Malvern actually includes Malvern Link, West Malvern, Colwall and a number of other smaller settlements nearby – and includes the green areas between these individual settlements.
The lowest areas are:
| Name | Leafiness |
| Grays | 0.05 |
| Thanet | 0.05 |
| Greater London | 0.06 |
| Stevenage | 0.06 |
| Exeter | 0.07 |
Embarassingly, I’d never heard of Grays – but it turns out it is on the banks of the Thames in East London, just east of the Dartford Crossing.
The most variable areas are:
| Name | CV |
| Thanet | 0.90 |
| Felixstowe | 0.67 |
| Reading | 0.64 |
| Blackpool | 0.62 |
| Greater Manchester | 0.60 |
and the least variable areas are:
| Name | CV |
| Bath | 0.22 |
| Yeovil | 0.23 |
| Stafford | 0.25 |
| York | 0.25 |
| Durham | 0.27 |
We can also plot mean against coefficient of variation, which allows us to examine where areas are placed when considering both the leafiness and the variability of this leafiness. The image below shows a static version of this graph – I actually produced an interactive version using my code to easily produce Bokeh plots with tooltips, and that interactive version can be found at the bottom of the notebook used to do the analysis.

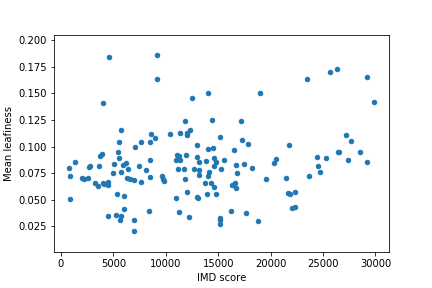
I also did a bit more analysis, extracting leafiness over all Lower Layer Super Output Areas (LSOAs) in Southampton, and joining the data with the Index of Multiple Deprivation from the 2011 census – aiming to discover if there is a link between leafiness and the deprivation of an area. Short answer: there isn’t – as the graph below demonstrates:
So, that’s the end of a fun bit of analysis – thanks to James O’Connor again for the idea.
If you found this post useful, please consider buying me a coffee.
This post originally appeared on Robin's Blog.
Categorised as: Academic, GIS, Programming, Remote Sensing
Leave a Reply