Some recent, and not so recent, talks and activities
There has been a long gap between posts (again!), and a lot of the stuff that I’m going to talk about in this post is fairly old too. Oh well, life keeps getting in the way of blogging.
Anyway, I’ve recently submitted a talk for the FOSS4G UK 2026 conference in Leeds in October, and have just found out that it’s been accepted. That reminded me that I never got round to posting about my workshop at the same conference last year…oops! So, here goes:
FOSS4G UK 2025 workshop: Live Vector Tiles from PostGIS with pg_tileserv
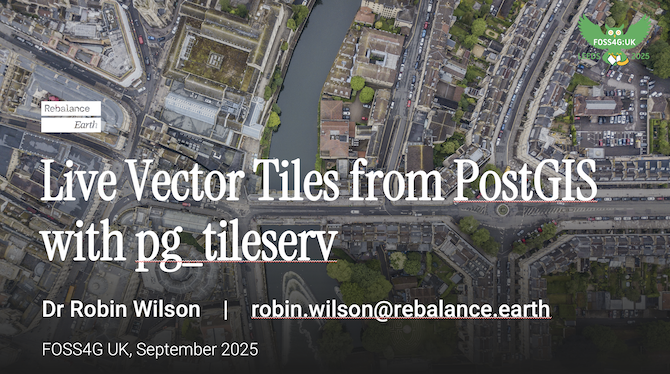
Last year at FOSS4G UK 2025, I ran a workshop on generating vector tiles live from a PostGIS database. The full description of the workshop from the schedule is available below, but I started by giving a bit of a talk about vector tiles, what they are, and the differences between pre-generated and on-the-fly vector tiles. I then gave a number of exercises to work on using a PostGIS cloud server that I (well, my current client) provided for people to play with. People worked through using pg_tileserv to server vector tiles on-the-fly, starting with consuming tiles for a table, and moving on to generating tiles from PostGIS functions.
Full workshop description
Vector tiles are a key part of many modern web mapping systems, but they don’t have to be generated ahead of time and stored. Instead, they can be generated ‘on the fly’ directly from the underlying data. Importantly this allows geospatial processing to be performed ‘live’ when the tiles are generated enabling many complex geospatial workflows, as well as reducing the need to pre-generate and store many different tiles.
This workshop will take you through the whole process of generating Mapbox Vector Tiles on the fly from a PostGIS database using a tool called pg_tileserv. We will start with an introduction to vector tiles and PostGIS, then move on to using pg_tileserv to generate tiles for database tables. After demonstrating basic tile serving to a local web map (using MapLibre) and QGIS, we will move on to defining PostGIS functions to integrate with pg_tileserv and do live geospatial processing as tiles are requested. Our demonstrations will focus on assessing flooding in the UK, but there will be plenty of opportunities for participants to try other sorts of processing.
To reduce the burden on participants, we will provide access to a pre-populated cloud PostGIS instance alongside a pg_tileserv deployment for the duration of the workshop, allowing users to participate in the workshop without installing or setting up any software beyond pgAdmin (or an alternative way to run SQL queries), a text editor and (optionally) QGIS. For those who want to run things locally or continue after the workshop, we will also provide a Docker Compose configuration.
It will be helpful for participants to have some experience with PostGIS and basic geospatial SQL, as well as a basic understanding of web mapping, Javascript and HTML.
The workshop materials are all available on the foss4guk_vector_tile_workshop Github repository. The cloud server we provided for the workshop is no longer running, but you can set up your own PostGIS server, add a few geospatial tables and run pg_tileserv yourself (it’s a simple Docker file) if you want to have a play. All the exercises are listed in the README file, and my slides are also available for download.
Electromagnetic Field 2026 talk: Lights, Spectrometer, Action!
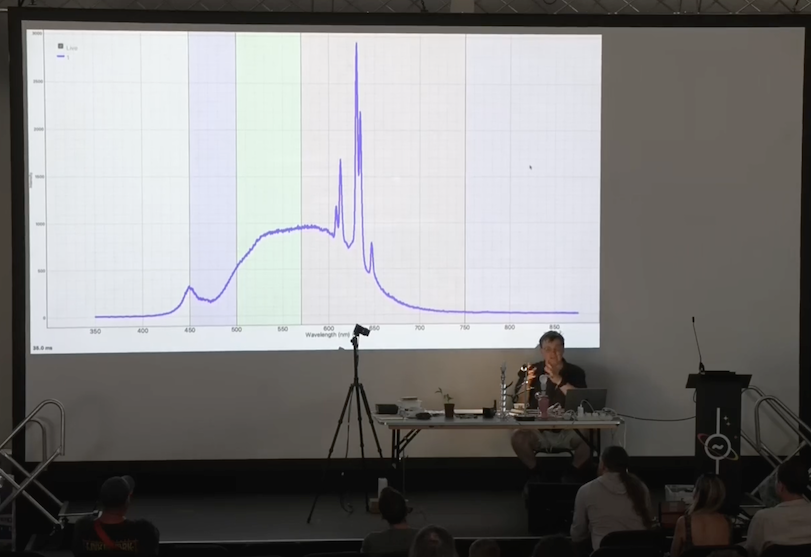
The Electromagnetic Field camping festival is a biannual highlight for me and my family. My wife, son and I all attended this year – and we brought my Mum along too – and we had a great time. My wife ran an over-subscribed workshop on lace making, and I gave a talk called Lights, Spectrometer, Action! which was all about spectrometry. That’s the science of measuring light at different wavelengths – and my talk included lots of live demos using a visible and near-infra-red spectrometer that I inherited from my late PhD supervisor, Prof Ted Milton.
The video of my talk is available online. The full talk description from the schedule is below, but in summary I look at light from various different light sources, then at reflected light from materials like leaves and soil, before finishing with a bit of absorption and emission spectrometry.
Full talk description
Come and watch me point a spectrometer at a load of things, and teach you about how light interacts with stuff. What’s a spectrometer, you ask? Well it’s a device that measures light and produces a graph of the brightness of the light at each wavelength. I inherited one last year, and this talk will mainly consist of live demos of the spectrometer, along with explanations of what we’re seeing and how it works. The talk will be accessible to almost anyone – you don’t need a lot of science knowledge to be able to enjoy it!
I’ll start with looking at some different light sources (incandescent bulbs, fluorescent bulbs, LEDs, sunlight, LCD displays) and then take a look at how a spectrometer works and what is inside the box. I’ll then introduce some other useful bits of kit, including a very expensive sheet of white plastic and a ‘sphere’ that has a surprisingly cuboid shape.
My background is in satellite imaging – which basically uses spectrometers mounted on satellites – so we’ll do a live look at the reflectance graphs we get for things we might be able to see from a satellite, like vegetation, soil and water and try to understand what causes these specific spectra. We’ll link these to real satellite images and cover some of the problems with doing spectroscopy from space – and even explain why a friend of mine did a whole PhD on the reflectance spectra of a concrete runway in the UK.
Finally we’ll try a few experiments that may or may not work, looking at the uses of spectroscopy in chemistry and measuring aerosols.
The talk took a lot of preparation, and I even ended up developing custom software to drive the spectrometer (see the repo). I’m hoping to add it to my list of talks that I give at local public science groups – though it requires quite a lot more setup and equipment than most of my other talks!
Advance notice: FOSS4G UK 2026 talk
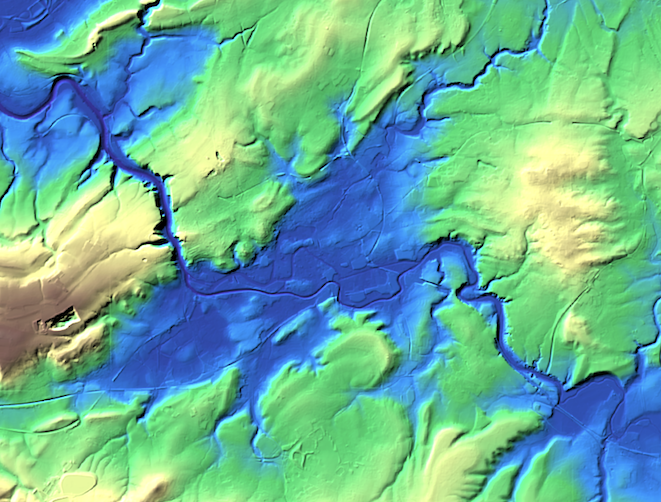
I’ll be giving a talk at FOSS4G UK 2026 called Open cloud-native access to Environment Agency DEM data using STAC and COG. Basically I’ve taken the openly-licensed Environment Agency DEM data and re-encoded it into cloud-native formats, made it far easier to use and re-released it. I’m looking forward to presenting it in a few months time – I just need to finish the development work first!
Full talk description
The Environment Agency provides openly-licensed LiDAR-derived DEM data covering the whole of England, but it is difficult to access this data. The web interface only allows downloads of small areas, manual bulk downloads produce hundreds of small TIFF files and the web map services have limited visualisation options. At Rebalance Earth, we needed easy access to large volumes of DEM data to analyse flood risk and design nature-based restorations to reduce flooding.
To solve this problem, we have converted the whole dataset to Cloud Optimized GeoTIFF (COG) and produced a STAC catalog linking to all these COG files. As the Open Goverment License allows redistributing the data, we’ve been able to make the new files and STAC catalog available online, free for anyone to use.
In this talk I’ll explain the benefits of cloud native geospatial data, and how we did the conversion (including some useful tips for creating COG files). I’ll then show some demos of how this data can be used – for example to easily produce mosaics of DEM data across arbitrary areas, to visualise in custom ways on a web map (tools like titiler and titiler-pgstac) and more. I’ll finish by explaining how you can connect to this dataset and access it yourself.
If you found this post useful, please consider buying me a coffee.
This post originally appeared on Robin's Blog.
Categorised as: Academic, Computing, GIS, Programming, Python, Remote Sensing
Leave a Reply