I released Cloud-Native Environment Agency DEM data!
At the FOSS4G UK 2026 conference in October, I gave a talk announcing that I’d re-released the Environment Agency DEM data for England in cloud-native formats. This was covering some work I did for my client Rebalance Earth and that we’ve decided to release openly.
If you already know what I’m talking about then you can find the data on Source Cooperative as COGs with STAC indexes. The README on that page will explain how to access the data, and you can access an interactive webmap of the data too. If that didn’t make full sense to you, then read on…
I’m not going to go into full details here, as sometime soon the video recording of my talk at the conference should be released, and I can link to that here. In the meantime, my slides are available and may help with understanding some of what I explain below.
So, basically, the Environment Agency (EA) collect LiDAR data across England and process it to produce Digital Elevation Model (DEMs). DEMs are rasters where every pixel contains a height value, and the EA produce two types: a Digital Terrain Model which is just the height of the terrain, and a Digital Surface Model which includes the height of everything on top of the ground – like buildings, trees and so on.
The EA provide access to this data under the Open Government License, but their web interface for getting hold of the data is a bit of a pain – you can’t download much data at once. You can ask for bulk access to the data, but even then you have to work out exactly what OS 5x5km grid squares you want, and the whole thing is a pain.
As the data is released under the OGL, people are allowed to re-release processed versions of it under the same license. So, I converted the files to modern cloud-native formats, specifically Cloud Optimized GeoTIFF with a Spatio-Temporal Asset Catalog. These formats store the data efficiently, allowing small parts of the image to be easily downloaded, as well as ‘zoomed-out’ lower-resolution versions of the data.
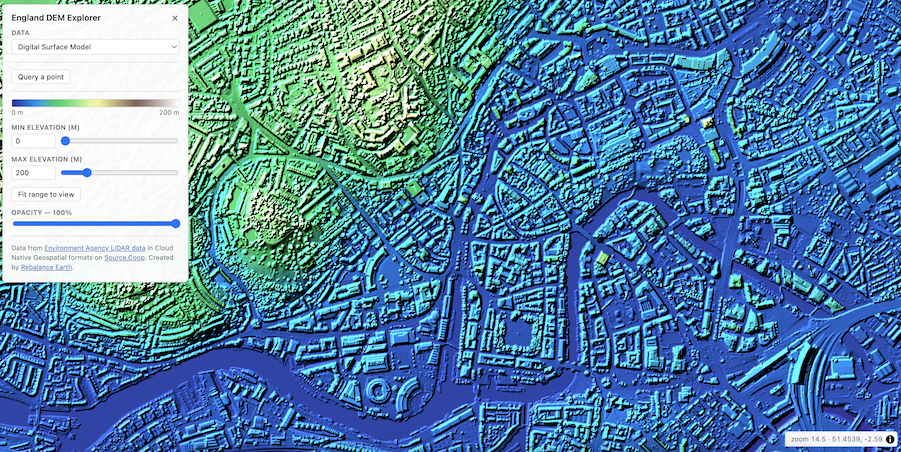
The upshot of all of this is that you can use a few lines of Python or a GDAL command-line to download and mosaic the DEM over any area you choose, and you can also display the data easily on a web map. The latter is quite impressive – you can see an example webmap here, which does live rescaling in the browser, along with hillshading and colour blending, producing a far nicer output than the EA’s viewer – the example below is the DSM over Bristol (the location of next year’s FOSS4G international conference!)
I’ll leave the detailed documentation on how to use this to the README file in the data repository, but a few quick examples will show how easy it is to use.
You can use a command like this to download and mosaic all of the DSM data in a particular bounding box:
gdal raster clip \
  --bbox 438000,108000,446000,116000 \
  GTI:/vsicurl/https://data.source.coop/rebalance-earth/ea-dem/ea-lidar-fz-dsm-1m-items.parquet output.tif
You can also do similarly in Python using the lazycogs library:
import lazycogs

da = lazycogs.open(
            “items.parquet”,
            bbox=lonlat_to_bng_bbox(bbox_lonlat),
            crs="EPSG:27700",
            resolution=1.0,
            chunks=chunks)

da = da.squeeze(["band", "time"], drop=True)
which gives you a nice xarray DataArray to play with.
The talk went down very well, and was described by some people as the "highlight of the conference" (including Alastair Graham on the Geomob Podcast). The data has also been downloaded quite a lot since the conference – there have been over 1 million individual downloads, with over 4TB of data transferred. Given that each tile of DEM data is only around 80MB in size then that’s the equivalent of half a million full tiles (the whole of England is only around 5,500 tiles).
I’m quite chuffed with this – it’s something I’ve wanted to do for ages but never quite got round to, until we found that my client Rebalance Earth needed something like this, and decided we could release it openly. I want to thank Rebalance Earth for paying me to work on this (alongside lots of other stuff) and covering my costs of attending the conference to present it.
If you found this post useful, please consider buying me a coffee.
This post originally appeared on Robin's Blog.
Categorised as: Academic, GIS, Programming, Python, Remote Sensing
Leave a Reply