Orthogonal Distance Regression in Python
Linear regression is often used to estimate the relationship between two variables – basically by drawing the ‘line of best fit’ on a graph. The mathematical method that is used for this is known as Least Squares, and aims to minimise the sum of the squared error for each point. The key question here is how do you calculate the error (also known as the residual) for each point?
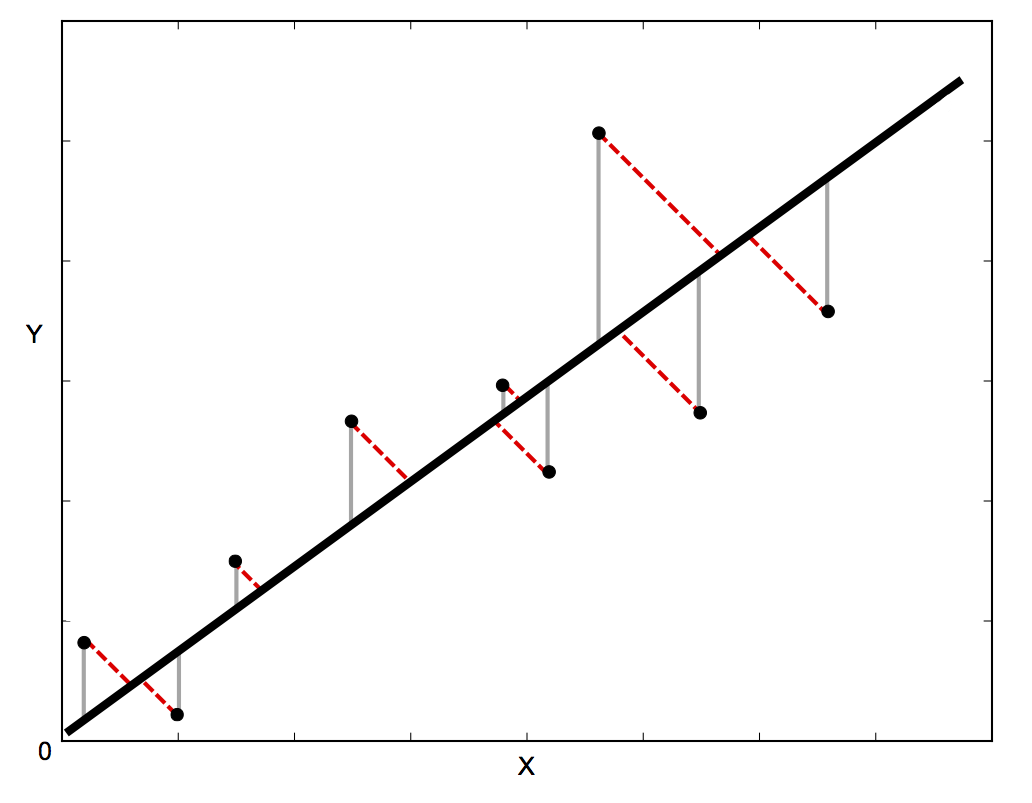
In standard linear regression, the aim is to predict the the Y value from the X value – so the sensible thing to do is to calculate the error in the Y values (shown as the gray lines in the image below). However, sometimes it’s more sensible to take into account the error in both X and Y (as shown by the dotted red lines in the image below) – for example, when you know that your measurements of X are uncertain, or when you don’t want to focus on the errors of one variable over another.
Orthogonal Distance Regression (ODR) is a method that can do this (orthogonal in this context means perpendicular – so it calculates errors perpendicular to the line, rather than just ‘vertically’). Unfortunately, it’s a lot more complicated to implement than standard linear regression, but fortunately there is some lovely Fortran code called ODRPACK that does it for us. Even more fortunately, the lovely scipy people have wrapped this Fortran code in the scipy.odr Python module.
However, because of the complexity of the underlying method, using the scipy.odr module is a lot harder than the simple scipy.stats.linregress function – so I’ve written some code to make it easier. The code below provides a function, orthoregress, which implements ODR and behaves in exactly the same way as the linregress function. For more information, see the ODRPACK User Guide, and the scipy.odr documentation.
If you found this post useful, please consider buying me a coffee.
This post originally appeared on Robin's Blog.
Categorised as: Academic, Programming, Python
[…] https://blog.rtwilson.com/orthogonal-distance-regression-in-python/ […]
Thank you for a very interesting post on regression using Python. I had never heard of Orthogonal Distance Regression so I learned both about that technique AND how to perform it. Very pedagogical post. Thank you, again.
Hi,it’s really wonderful to read your blog!
Can you tell me more about the “it calculates errors perpendicular to the line, rather than just ‘vertically” ?
For me ,it is just the same, am I right ?
Thank you very much !
Hi,
The error calculation is actually different: the vertical errors are shown in gray in the image, and the perpendicular errors are shown in dotted red lines. The vertical errors are just the errors in the ‘y’ direction, whereas the perpendicular errors take into account errors in both ‘x’ and ‘y’.
Hope that helps!
Robin
[…] Orthogonal Least Squares: https://blog.rtwilson.com/orthogonal-distance-regression-in-python/ […]
If you have data with errors in y and x, is it ok to just replace “dat = Data(x, y)” with “dat = RealData(xdata, y=ydata, sx=error_x, sy=error_y)”? It produces estimators, that are really close to the one I got using a ROOT fit with TGraphErrors at least…
Just want to point out, for the case of the “line of best fit” you are presenting, there exists a solution which can be calculated analytically (and of course much faster than using scipy.odr). Actually, two solutions exist and one is optimal, minimizing the sum of perpendicular distances.
See: http://mathworld.wolfram.com/LeastSquaresFittingPerpendicularOffsets.html
Great post though… got me started.
I would like to point out the Answer of Vincent saying that he is right about an easier solution using the analytical form but it exists only if the curve is a straight line y=a+bx. For other non-linear formulas there may or may not exist an analytical solution and for cases when y=f(a,b,x) being f() some non separable function, there is no closed form solution and the numerical method using scipy or simialr is needed.
Hi, thank you very much for this interesting article. I have a question: do you know how to calculate the r-squared and the standard deviation of the law in python calculated with the ODR algorithm?
Thank you very much.
Thank you so much for this, nice short explanation. Quick question. What about beta0? what is beta0?
beta0 is documented at https://docs.scipy.org/doc/scipy/reference/generated/scipy.odr.ODR.html#scipy.odr.ODR. Basically, it’s the initial parameter values which are then refined by the ODR procedure. In my code, these are set to the estimates from standard linear regression. Hope that helps, Robin.
You may like my implementation of ODR in Python also here
https://stackoverflow.com/a/60441689/4999991
Hi,
thanks for the nice post. Do you know if there a function available to do Orthogonal Distance Regression with multiple variables in Python? I would like to do the regression on y = A+Bx1+Cx2+Dx3.
I’ve never tried it, but I think the underlying scipy ODR submodule will do multi-variable ODR – the documentation is available at https://docs.scipy.org/doc/scipy/reference/odr.html and more help would probably be available on the scipy mailing list or on StackOverflow.
[…] (If you liked this post, then you may also like An easy way to install Jupyter Notebook extensions, Bokeh plots with DataFrame-based tooltips, and Orthogonal Distance Regression in Python) […]