Recently I ran into a situation where I needed to select Landsat scenes by various criteria – for example, to find images over a certain location, within a certain date range, with other requirements on cloudiness and so on. Normally I’d do this sort of filtering using a tool like EarthExplorer, but I needed to do this for about 300 different sets of criteria – making an automated approach essential.
So, I found a way to get all of the Landsat metadata and import it into a database so that I could query it at will and get the scene IDs for all the images I’m interested in. This post shows how to go about doing this – partly as a reference for me in case I need to do it again, but hopefully other people will find it useful.
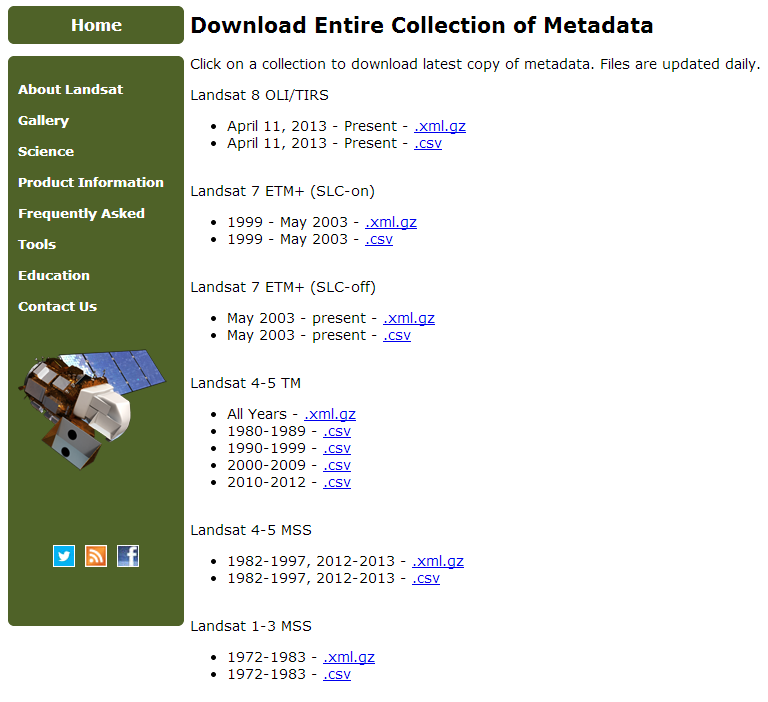
So, to start, you need to get the Landsat metadata from the USGS. On this page, you can download the metadata files for each of the Landsat satellites separately (with Landsat 7 metadata split into SLC-on and SLC-off).
You’ll want the CSV files, so click the link and have a break while it downloads (the CSV files are many hundreds of megabytes!). If you look at the first line of the CSV file once you’ve downloaded it (you may not want to load it in a text editor as it is such a huge file, but something like the head command will work fine), you’ll see the huge number of column headers giving every piece of metadata you could want! Of course, most of the time you won’t want all of the metadata items, so we want to extract just the columns we want.
The problem with this is that lots of the traditional tools that are used for processing CSV files – including text editors, database import tools and Excel – really don’t cope well with large CSV files. These Landsat metadata files are many hundreds of megabytes in size, so we need to use a different approach. In this case, I found that the best approach was using one of the tools from csvkit, a set of command-line tools for processing CSV files, written in Python. One of the key benefits of these tools is that they process the file one line at a time, in a very memory-efficient way, so they can work on enormous files very easily. To extract columns from a CSV file we want to use csvcut, and we can call it with the following command line
This will extract the 5th, 6th, 1st, 2nd 3rd etc columns from LANDSAT_ETM.csv to LANDSAT_ETM_Subset.csv. To get a list of the columns in the file along with their ID number, so that you can choose which ones you want to extract, you can run:
csvcut -n LANDSAT_ETM.csv
After doing this you’ll have a far smaller CSV file in LANDSAT_ETM_Subset.csv that just contains the columns you’re interested in. There’s only one problem with this file – it still has the headers at the beginning. This is great for a normal CSV file, but when we import it into the database we’ll find that the header line gets imported too – not what we want! The easiest way to remove it is using the following command:
cat LANDSAT_ETM_Subset.csv | sed "1 d" > LANDSAT_ETM_Subset.csv
Again, this doesn’t load the whole file in to memory, so will work with large files happily.
We then need to create the database. This can be done with any database system, but to get a simple local database I decided to use SQLite. Once you’ve installed this you can do everything you need from the command-line (you can create the tables using a GUI tool such as SQLite Administrator, but you won’t be able to do the import using that tool – it’ll crash on large CSV files). To create a database simply run:
sqlite LandsatMetadata.sqlite
which will create a database file with that name, and then drop you in to the SQLite console. From here you can type any SQL commands (including those to create or modify tables, plus queries), plus SQLite commands which generally start with a . In this case, we need to create a table for the various columns we’ve chosen from our CSV. It is important here to make sure that the column names are exactly the same as those in the CSV, or the import command won’t work (you can change the names later with ALTER TABLE if needed). You can take the following SQL and modify it to your needs.
Just type this into the SQLite console and the table will be created. We now need to import the CSV file, and first we have to define what is used as the separator in the file. Obviously, for a CSV file, this is a comma, so we type:
.separator ,
And then to actually import the CSV file we simply type:
.import LANDSAT_ETM_Subset.csv images
That is, .import followed by the name of the CSV file and the name of the table to import into. Once this is finished – it may take a while – you can check that it imported all of the rows of the CSV file by running the following query to get the number of rows in the table:
SELECT COUNT() from images;
and you can compare that to the output of
wc -l LANDSAT_ETM_Subset.csv
which will count the lines in the original file.
Your data is now in the database and you’re almost done – there’s just one more thing to do. This involves changing how the dates and times are represented in the database, so you can query them easily. Still in the SQLite console, run:
UPDATE images
SET startTime=time(substr(images.sceneStartTime,10, length(images.sceneStartTime)));
And then…you’re all done! You can now select images using queries like:
SELECT * FROM images WHERE path=202 AND row=24
AND acquisitionDate > date("2002-03-17","-1 months")
AND acquisitionDate < date("2002-03-17","+1 months")
Once you’ve got the results from a query you’re interested in, you can simply create a text file with the sceneIDs for those images and use the Landsat Bulk Download Tool to download the images.
Yes, almost always. I’ve found this a lot easier since I started using Git – to start using version control with Git simply requires running "git init" – whereas with SVN you had to configure a new repository and do all sorts of admin work before you could start. Of course, if you want to host the Git repository remotely then you’ll need to do some admin, but all of that can be done at a later date, once you’ve started recording changes to your code. This really helps me start using version control from the beginning of the project – there’s less to interrupt me when I’m in the mood to write code, rather than to fiddle around with admin.
Occasionally I still forget to start using version control at the beginning of a project, and I always kick myself when I don’t. This tends to be when I’m playing around with something that doesn’t seem important, and won’t have any future…but it’s amazing how many of those things go on to become very important (and sometimes get released as open-source projects of their own). I’m trying to remember to run git init as soon as I create a new folder to write code in – regardless of what I’m writing or how important I think it’ll be.
8. If you show analysis results to a colleague and they offer a suggestion for improvement, can you adjust your script, re-run it, and produce updated results within an hour?
Sometimes, but often not – mainly because most of my analyses take more than an hour to run! However, I can often do the alterations to the script/data and start it running within the hour – and colleagues are often surprised at this. For example, someone I’m currently working with was very surprised that I could re-run my analyses, producing maximum values rather than mean values really easily – in fact, within about five minutes! Of course, all I needed to do in my code was change the mean() function to the max() function, and re-run: simple!
I’ve already talked a bit on this blog about ProjectTemplate – a library for R that I really like for doing reproducible research, and the benefits of ProjectTemplate are linked to this question. By having defined separate folders for library functions and analysis functions – and by caching the results of analyses to stop them having to be run again (unless they’ve changed), it really helps me know what to change, and to be able to produce new results quickly. I’d recommend all R programmers check this out – it’s really handy.
9. Do you use assert statements and test cases to sanity check the outputs of your analyses?
Rarely – except in libraries that I develop, such as Py6S. I recently wrote a post on how I’d set up continuous integration and automated testing for Py6S, and I am strongly aware of how important it is to ensure that Py6S is producing accurate results, and that changes I make to improve (or fix!) one part of the library don’t cause problems elsewhere. However, I don’t tend to do the same for non-library code. Why?
Well, I’m not really sure. I can definitely see the benefits, but I’m not sure whether the benefits outweight the time that I’d have to put in to creating the tests. Assert statements would be easier to add, but I’m not sure if I should start using them in my code. Currently I use exception handling in Python to catch errors, print error messages and – crucially – set all of the results affected by that error to something appropriate (normally NaN), and these have the benefit that the code continues to run. So, if one of the 100 images that I’m processing has something strange about it then my entire processing chain doesn’t stop, but the error gets recorded for that image, and the rest of the images still get processed. I actually think that’s better – but if someone has an argument as to why I should be using assert statements then I’d love to hear it.
I recently read the article Don’t be a technical masochist on John D. Cook’s blog, and it struck a chord with me about the way that I see people choosing software and programming tools in my field.
John states "Sometimes tech choices are that easy: if something is too hard, stop doing it. A great deal of pain comes from using a tool outside its intended use, and often that’s avoidable…a lot of technical pain is self-imposed. If you keep breaking your leg somewhere, stop going there.".
I like to think that I can do some GIS/remote-sensing analyses more efficiently than others – and I think this is because I have a broad range of skills in many tools. If the only GIS/Remote Sensing tool you know how to use is ArcGIS then you try and do everything in Arc – even if the task you’re doing is very difficult (or even impossible) to do within Arc. Similarly, if you only know Python and won’t touch R, then you can’t take advantage of some of the libraries that are only available in R, which might save you a huge amount of time. I wouldn’t say I’m an expert in all of these tools, and I prefer some to others, but I have a working knowledge of most of them – and am able to acquire a more in-depth knowledge when needed.
Don’t get me wrong, sometimes it is very important to be able to do things within a certain tool – and sometimes it’s worth pushing the boat out a bit to try and see whether it’s possible to get a tool to do something weird but useful. Often though, it’s better to use the best tool for the job. That’s why, if you watch me work, you’ll see me switching backwards and forwards between various tools and technologies to get my job done. For example:
I’m currently working on a project which involves a lot of time series manipulation. When I started this project, the Python pandas library (which deals very nicely with time series) wasn’t very mature, and I wasn’t prepared to ‘bet the project’ on this very immature library. So, even though Python is my preferred programming language, I chose to use R, with the xts library to handle my time-series analysis.
I don’t use ArcGIS for remote sensing analysis, and I don’t use ENVI to do GIS. Yes, both programs allow you to deal with raster and vector data, but it’s almost always easier to use ENVI to do the remote sensing work, and then transfer things into ArcGIS to overlay it with vector data or produce pretty output maps (ENVI’s map output options are pretty awful!). I’ve lost track of the number of students I’ve found who’ve been really struggling to do satellite data processing in ArcGIS that would have taken them two minutes in ENVI.
If there’s a great library for a different programming language then I use it. For example, I recently needed to create a set of images where each pixel contained a random value, but there was spatial correlation between all of the values. I investigated various tools which purported to be able to do this (including some random Python code I found, ArcGIS, specialist spatial stats tools and R) and in the end the one that I found easiest to get it to work in was R – so that’s what I used. Yes, it meant I couldn’t drive it easily from Python (although using RPy, or, as a last resort, running R from the command line using the Python subprocess module) but that was a far easier option compared to trying to write some code to do this from scratch in Python.
Overall, the tools I use for my day-to-day work of GIS/Remote-sensing data processing include (in approximate order of frequency of use): ENVI, GDAL’s command-line tools, QGIS, ArcGIS, GRASS, eCognition, PostGIS, Google Earth, BEAM, and probably more that I can’t think of at the moment. On top of that, in terms of programming languages, I use Python the most, but also R and IDL fairly frequently – and I’ve even been known to write Matlab, Mathematica and C++ code when it seems to be the best option (for example, Mathematica for symbolic algebra work).
Having a basic knowledge of all of these tools (and, of course, having them installed and set up on my computers and servers) allows me to get my work done significantly faster, by using the best (that is, normally, easiest) tool for the job.
This is the second in my series of posts examining how well I fulfil each of the items on the Philip Test. The first part, with an explanation of exactly what this is, is available here, this time we’re moving on to the next three items in the list:
4. Are your scripts, data sets and notes backed up on another computer?
Let’s take these one at a time. My scripts are nearly always backed up. The exact method varies: sometimes it is just by using Dropbox, but I try to use proper source control (with Git and Github) as much as possible. The time that this falls apart is when I’ve been developing some code for a while, and just somehow ‘forgot’ to put it in source control at the start, and then never realise! This is particularly frustrating when I want to look at the history of a project later on and find one huge commit at the beginning with a commit message saying "First commit, forgot to do this earlier – oops".
Of course, Git by itself doesn’t count as a backup, you need to actually push the commits to some sort of remote repository to get a proper backup. I try to keep as much of my code open as possible, and make it public on Github (see the list of my repositories), but I can’t do this with all of my code – particularly for collaborative projects when I don’t have the permission of the other contributors, or when the license for parts of the code is unknown). For these I tend to either have private repositories on Github (I have five of these free as part of a deal I got), or to just push to a git remote on my Rackspace server.
Notes are fairly straightforward: electronic notes are synchronised through Dropbox (for my LaTeX notes), and through Simplenote for my other ASCII notes. My paper notes aren’t backed up anywhere – so I hope I don’t loose my notebook!
Data is the difficult part of this as the data I use is very large. Depending on what I’m processing, individual image files can range from under 100Mb to 30-40Gb for a single image (the latter is for airborne images which have absolutely huge amounts of data in them). Once you start gathering together a lot of images for whatever you’re working on, and then combine these with the results of your analyses (which will often be the same size as the input images, or possibly even larger), you end up using a huge amount of space. It’s difficult enough finding somewhere to store this data – let alone somewhere to back it up! At the moment, my computer at work has a total of 4.5Tb of storage, through both internal and external hard drives, plus access to around 1Tb of networked storage for backup – but I’m having to think about buying another external hard drive soon as I’m running out of space.
One major issue in this area is that university IT services haven’t yet caught up with ‘the data revolution’, and don’t realise that anyone needs more than a few Gb of storage space – something that really needs to change! In fact, data management by itself is becoming a big part of my workload: downloading data, putting in sensible folder structures, converting data, removing old datasets etc takes a huge amount of time. (It doesn’t help that I’m scared of deleting anything in case I need it in future!).
5. Can you quickly identify errors and inconsistencies in your raw datasets?
Hmm, I’d probably say "most of the time". The problem with working on satellite images is that often the only sensible way to identify errors and inconsistencies is to view the images – which is fun (I like actually looking at the images, rather than always working with the raw numbers), but time-consuming. As for non-image data, I find a quick look at the data after importing, and using some simple code to sanity-check the data (such as np.all(data > 0) to check that all of the data have positive values) works well.
The key tools that allow me to do this really easily are Python – particularly with numpy and pandas, ENVI for looking at satellite images (unfortunately I haven’t found any open-source tools that I am quite as productive with), and text editors for reading files. I often use Excel for looking at raw CSV data, although I hate how much Excel pesters me about how "not all features are supported in this file format" – I’d really like a nice simple ‘CSV file viewer’, if anyone knows of one?
6. Can you write scripts to acquire and merge together data from different sources and in different formats?
Yes – but only because I have access to such brilliant libraries.
One thing I end up doing a lot of is merging time series – trying to calculate the closest measurement from a satellite to some sort of ground measurement. I’ve done this in a couple of different ways: sometimes using xts in R and sometimes with Pandas in Python. To be honest, there isn’t much to choose between them, and I tend to use Python now as most of my other code is written in Python.
GDAL/OGR is an essential tool for me to access spatial data through Python code – and, depending on the application, I often use the nicer interfaces that are provided by fiona, rasterio and RIOS.
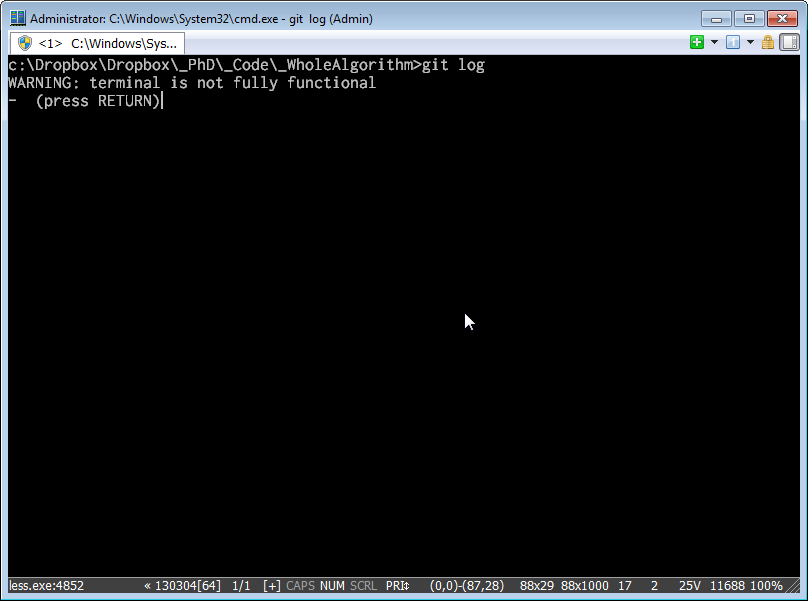
For a while now I’ve been frustrated by an error that I get whenever I’m using git on Windows. When I try and run certain git commands – such as git log or git diff – I get the following message:
Git error message stating “WARNING: terminal not fully functional”
The error message “WARNING: terminal not fully functional” appears, but if you press return to continue, the command runs ok (albeit without nice colours). I’d just put up with this for ages, but decided to fix it today – and the fix is really simply. Basically, the problem is that the TERM environment variable is set to something strange, and git can’t cope with it – so warns you that there might be trouble.
So, to fix this, you just need to make sure that the TERM environment variable is set to “xterm”, which is the standard graphical terminal on Linux machines. There are a number of ways that you can do this:
Set this variable using the built-in Windows interface – see these instructions
Use a helpful tool to make this easier (particularly if you often set other environment variables, as I do), like Rapid Environment Editor
Set it in an initialisation batch script – such as the init.bat file that is used by the Cmder swish Windows command-line tool
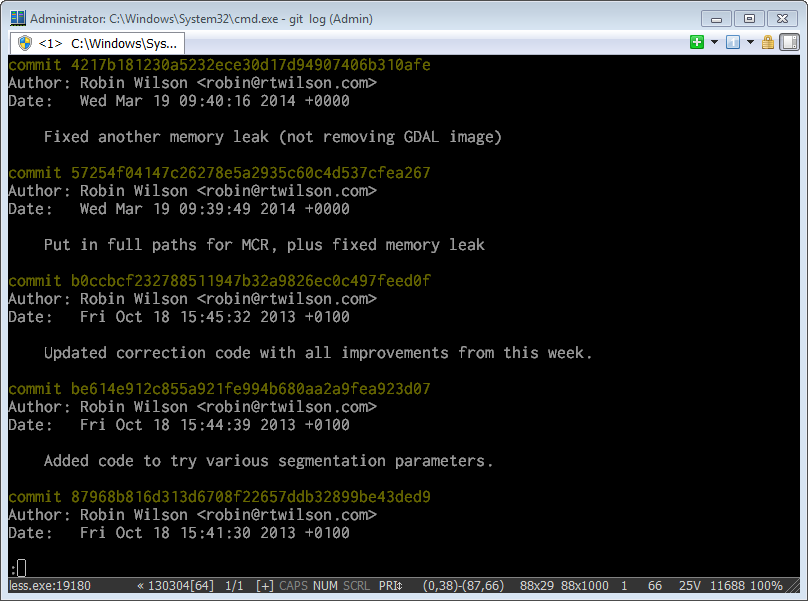
Once you’ve set this (you can even test it by just running set TERM=xterm on the command line), everything should work fine – and you’ll get colours back again:
Summary: Rackspace are great: easy-to-use control panel, helpful support, fast servers and I got it all for free to host my open-source projects! Upgrading servers isn’t as easy as it could be, but that’s a very minor problem overall.
After thinking about it for a while, I took advantage of Jesse Noller’s offer that I found on Twitter
Yup. Free @Rackspace cloud accounts for OSS projects and communities – we have them. Just email jesse.noller@rackspace.com
and emailed requesting a free Rackspace account to host Py6S, PyProSAIL and RTWTools (along with my other Open-Source projects). To be honest, I wasn’t sure that my projects would quality – they are relatively niche (although useful within my field) – but Jesse replied quickly and said he’d get things setup for me. I was amazed when they offered $2000 per month in expenses for servers, storage and so on – seems like an amazing amount of money for me!
Setup was nice and easy – I created an account and then got a phonecall from a lovely chap to confirm I was who I said I was. Even though I forgot to put the proper country code on my phone number when registering, they obviously realised I was from the UK and got through to me – and called at a sensible time of the day for me (middle of the night for them!). Anyway, as soon as I’d had the phonecall and confirmed with Jesse, I could start getting things set up.
I hadn’t really used cloud servers before, so wasn’t sure exactly what to expect, but there were helpful guides on their website. I created a Linux server, followed their guide to set it up securely (turning off root access via SSH, changing SSH port, setting up a firewall etc) and got apache working. It was great to have root access on a webserver (previously I’d had shared hosting through Dreamhost, and had been frustrated at being unable to do some things) – I could configure anything to my heart’s content – although I was aware that all of the security would also be down to me!
Anyway, I then created a Windows server to allow me to easily test my software on a Windows machine that doesn’t matter (my work machine is too important for me to possibly screw-up by testing weird configurations of my code on it). This machine was costing a fair amount per hour to host, so I assumed I could start it up and shut it down at will, like I’d heard that you could do on Amazon’s cloud, but I then found out that didn’t seem to be the case. If you want to shutdown a server so you’re not paying for it, you have to image the server, delete the server, and then recreate it using the image – possible, but a bit of a pain. That’s not a major problem for me, as I’m getting it all for free, but might be a bit of a frustration for people who are paying for it!
After playing around with my Linux server a bit, I got my software installed and tried to run it. The underlying model (6S, which I didn’t write), kept crashing and I had no idea why. I contacted Rackspace Support, who were very helpful – even though the software I was trying to run was nothing to do with them – and suggested that I tried upgrading to a better spec server. This was a bit of a pain (I had to image the server, delete it, and then create a new one from the image), but I’ve now upgraded to a nice fancy server which is able to run my code in parallel (makes running the tests far faster!).
A RStudio web-interface (for playing around with possible Py6S/R integration)
An IPython Notebook server (whenever needed, with authentication of course) for doing manual testing of Py6S on the server remotely without needing to SSH
Private Git repositories for various pieces of code that will be open-sourced, but aren’t quite ready to reveal to the world yet
Backups of previous binary versions of RTWTools
And more… (I’m sure I’ve forgotten things)
I also have another server running at the moment with a heavily-secured IPython Notebook interface running on it, for use in some Py6S teaching that I will be doing shortly.
So, overall the experience has been great, and once I got the server setup I’ve barely had to touch the Rackspace Control Panel, the server has Just Worked ™, with no downtime or problems at all. So – thanks Rackspace!
Philip Guo, who writes a wonderful blog on his views and experiences of academia – including a lot of interesting programming stuff – came up with a research programming version of The Joel Test last summer, and since then I’ve been thinking of writing a series commenting on how well I fulfil each of the items on the test.
For those of you who haven’t come across The Joel Test – it’s a list of simple Yes/No questions you can answer to measure the quality of your software team. Questions include things like: Do you use source control? and Can you make a build in one step? Philip came up with a similar set of questions for research programmers (that is, people who program as part of their research work – which includes researchers in a very wide range of fields these days).
So, starting with the first few questions:
1. Do you have reliable ways of taking, organizing, and reflecting on notes as you’re working?
2. Do you have reliable to-do lists for your projects?
These are probably the most important questions on the list, but it’s something that I’ve often struggled to do well. I often wish for a system like the prototype that Philip developed as part of his PhD (see here), but that wasn’t suitable for use in production. Instead, I tend to make do with a few different systems for different parts of my work.
I have a large ‘logbook’ for my main PhD work (it’s even got the logo of my University on it, and some pages at the back with information on Intellectual Property law), which I try and use as much as possible. This includes comments on how things are working, notes from meetings with my supervisors, To Do lists and so on. When I want to keep electronic notes on my PhD I tend to keep long notes in LaTeX documents (I can write LaTeX documents almost effortlessly now) like my PhD status document (a frequently-updated LaTeX document that I have which has the planned structure of my PhD thesis in it, with the status of each piece of work, and planned completion dates). I often keep shorter notes in Simplenote – a lovely simple web-based ASCII text note system, which synchronises with Notational Velocity for OS X and Resoph Notes for Windows.
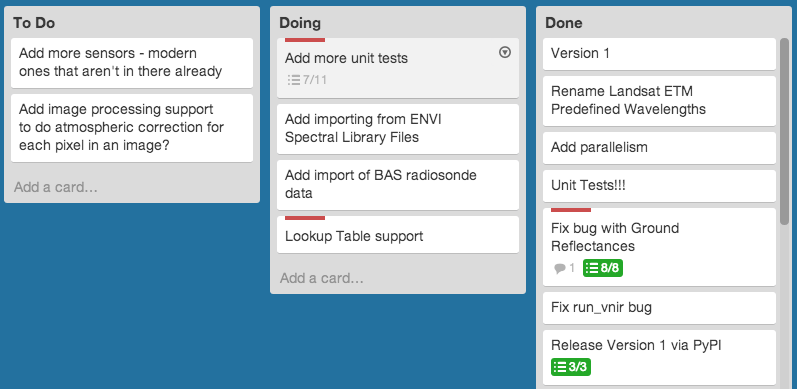
For my other academic-related work, I tend to make notes in simple text files (I’m a big fan of README.txt files in project folders), Simplenote, or Trello. For managing my academic software (such as Py6S and RTWTools) I tend to use Trello, with a board for each project, and cards for To Do items, bugs and so on.
I also keep my Research Ideas list in Trello – and try and keep it updated as often as possible.
3. Do you write scripts to automate repetitive tasks?
Yes – to an extreme extent, because I’ve been burnt too many times.
I now get scared when I have to do proper analysis through a non-scriptable method – because I know that I’ll have to repeat it at some point, and I know it’ll take a lot of work. I’ve just finished the analysis for a project which is entirely reproducible, apart from a key stage in the middle where I have to export the data as a CSV file and manually classify each row into various categories. That scares me, because when it all needs redoing for whatever reason, the rest of the analysis can be run with a click of a button, but this bit will require a lot of work.
In that example – as in most cases – the manual work probably could be automated, but it’d take so much effort that it (probably) wouldn’t be worth it. It still scares me though…
Looking at this more positively, I find that I’m quite unusual in exactly how much I automate. I know quite a few people who will automate some particularly frustrating repetitive tasks, such as renaming files or downloading data from a FTP site, but I try and do as much of my analysis as possible in code. This really shines through when I need to do the analysis again: I can click a button and go and have a break while the code runs, whereas my colleagues have to sit there clicking around in the GUI to produce their results.
In terms of the tools that I use to do this, they vary depending on what I’m trying to do:
For specific tasks in certain pieces of software, I’ll often use the software’s own scripting interface. For example, if there is already an ENVI function that does exactly what I want to do – and if it is something relatively complex that it would take a lot of effort to implement myself – I’ll write some IDL code to automate running the process in ENVI. Similarly, I’d do the same for ArcGIS, and even Microsoft Office.
For filesystem-related tasks, such as organising folder hierarchies, moving, copying and renaming files, I tend to either use unix commands (it’s amazing what can be done with a few commands like find, mv and grep combined together), simple bash scripts (though I am by no means an expert) or write my own Python code if it is a bit more complex.
For most other things I write Python code – and I tend to find this the most flexible way due to the ‘batteries included’ approach of the standard library (and the Python Module of the Week website to find out how best to use it) and the wide range of other libraries that I can interface with. I’ll be posting soon on my most frequently-used Python modules – so look out for that post.
So, that’s the first three items on the Philip Test – stay tuned for the next three.
Today I got sent a file by a colleague in OSM format. I’d never come across the format before, but I did a quick check and found that OGR could read it (like pretty much every vector GIS format under the sun). So, I ran a quick OGR command:
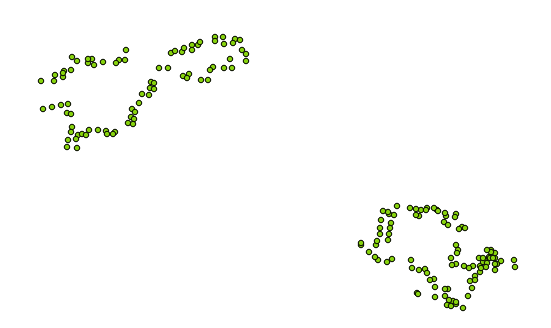
Oh dear. The data that I was given was meant to be polygons covering village areas in India, but when I imported it I just got all of the vertices of the polygons. I looked around for a while for the best way to convert this in QGIS, but I gave up when I found that the attribute table didn’t seem to have any information showing in which order the nodes should be joined to create polygons (without that information the number of possible polygons is huge, and nothing automated will be able to do it).
Luckily, when I opened the OSM file in a text editor I found that it was XML- and fairly sensible XML at that. Basically the format was this:
Under a main <osm> tag, there seemed to be a number of <node>’s, each of which had a latitude and longitude value, and then a number of <way>’s, each of which defined a polygon by referencing the nodes through their ID, and then adding a few tags with useful information. Great, I thought, I can write some code to process this!
So, that’s what I did, and for those of you who don’t want to see the full explanation, the code is available here.
I used Python, with the ElementTree built-in library for parsing the XML, plus the Shapely and Fiona libraries for dealing with the polygon geometry and writing the Shapefile respectively. The code is fairly self-explanatory, and is shown below, but basically accomplishes the following tasks:
Iterate through all of the <node> elements, and store the lat/lon values in a dictionary with the ID used as the key of the dictionary.
For each <way>, iterate through all of the <nd> elements within it and use the ID to extract the appropriate lat/lon value from the dictionary we created earlier
Take this list of co-ordinates and create a Shapely polygon with it, storing it in a dictionary with the name of the village (extracted from the <tag> element) used as the key
Iterate through this dictionary of polygons, writing them to a shapefile
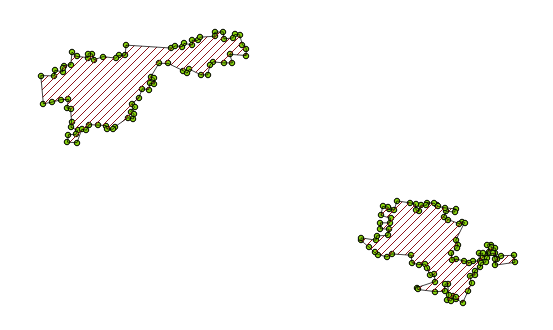
After all of that, we get this lovely output (overlain with the points shown above):
The code definitely isn’t wonderful, but it does the job (and is relatively well commented, so you should be able to modify it to fit your needs). It is below:
I’ve spent a long time over the last few days struggling with a problem with a Flask webapp that I’ve been developing. The app worked fine on my local computer, but when I tried to deploy it to my web server and run it via WSGI it seemed to ‘just hang’.
That is – when I visited the URL my browser said Waiting…, but there was nothing in the Apache error log or access log, it didn’t seem to have even registered that I was trying to visit the page. I had no idea what was going on, and after a long period of debugging, I found that removing some of the module imports stopped it hanging. In this case, it was removing the import for Py6S (my Python interface to the 6S Radiative Transfer Model) and matplotlib.
I had no idea why this fixed the problem, and after a lot of searching I found that it was all caused by my Apache WSGI configuration. Documenting this here will hopefully help others with the problem – and also remind me what to do next time that I want to deploy a WSGI app.
Basically, if you’ve got a directory structure like this:
/usr/local/www/wsgi-scripts
Web6S
static
custom.css
templates
index.html
web6s.py
web6s.wsgi
That is, a folder for the app (Web6S in this example), with the main file for the app given the same name (web6s.py), and a similarly-named WSGI file (web6s.wsgi).
The WSGI file has the following contents:
import sys
sys.path.insert(0, '/usr/local/www/wsgi-scripts/Web6S')
from web6s import app as application
which alters the Python path to add the directory that the app is in, and then imports the app object, calling it application (which is what WSGI requires).
That’s fairly simple – the harder bit is the Apache configuration. I’d suggest creating a virtualhost for this, to keep the configuration separate from your other bits of Apache configuration. My configuration is:
Probably these bits aren’t all essential, but this is what seems to work for me. I didn’t have bits like the WSGIDaemonProcess line before, but adding them fixed it (I can’t guarantee that this is correct, but it works for me).
So, adding those lines into the correct files and restarting Apache should make it work – Good Luck!
As a Fellow of the Software Sustainability Institute I’m always trying to make my software more sustainable – and one element of this is ensuring that my software works correctly. Although crashes might annoy users (which generally isn’t a good plan if you want your software to be well-used), a far worse problem is your software producing subtly-incorrect results – which may not be noticed until papers have been published, sensors designed and large research projects started. Definitely not something I want to happen with Py6S!
So, for a while now I’ve been writing various tests for Py6S. You can find them all in the tests folder of the Py6S code, and they can be run by simply running nosetests in the root of the Py6S source code tree. Adding these tests was definitely an improvement, but there were two problems:
I kept forgetting to run the tests after I’d changed things. Then, just before a release I’d remember to run the tests (hopefully!) and find all sorts of problems and have to try and work out how I’d created them.
These tests were mostly regression tests. That means that I ran something in Py6S at the Python console, and then created a test to ensure that the same code would produce the same output that I’d just got. This is useful – as it protects against ‘regressions’, where changes to one part of the code also break things elsewhere – but it doesn’t test that Py6S itself actually produces the right answers. After all, it might have been wrong all along, and a regression test wouldn’t pick that up!
So, I decided to have a big push on testing Py6S and try and fix both of these problems.
Firstly, I set up a Continuous Integration server called Jenkins on my nice shiny Rackspace cloud server. Continuous Integration tools like this are often used to compile software after every commit to the source control system, to ensure that there aren’t any compiler errors that stop everything working – and then to run the test suite on the software. Of course, as Py6S is written in Python it doesn’t need compiling – but using Jenkins is a good way to ensure that the tests are run every time a modification to the code is committed. So now I simply alter the code, commit it, push to Github and Jenkins will automatically run all of the tests and send me an email if anything has broken. Jenkins even provides a public status page that shows that the Py6S build is currently passing all of the tests, and even provides graphs of test failures over time (shown below – hopefully automatically updating from the Jenkins server) and test coverage.
Using Jenkins to provide test coverage reports (which show which lines of code were executed during the tests, and therefore which lines of code haven’t been tested at all) showed me that quite a lot of important bits of Py6S weren’t being tested at all (even with regression tests), and of course I still had the problem that the majority of my tests were just regression tests.
I wasn’t sure what to do about this, as I couldn’t replicate all that 6S does by hand and check that it is giving the right results (even if I knew enough to do this, it’d be very time-consuming to do), so how could I do anything other than regression tests? Suddenly, the answer came to me: replicate the examples! The underlying 6S model comes with example input files, and the expected outputs for those input files. All I needed to do was to implement Py6S code to replicate the same parameterisation as used in the input files, and check that the outputs were the same. Of course, I wouldn’t do this for every parameter in the output files (again, that’d take a long time to manually setup all of the tests – although it may be worth doing sometime) – but a few of the most-used parameters should give me a high confidence that Py6S is giving the same results as 6S.
So, that’s what I did. The code is available on Github, and all of these example-based tests pass (well, they do now – as part of writing the tests I found various bugs in Py6S which I fixed).
Overall, I have a far higher confidence now that Py6S is producing correct results, and using Continuous Integration through Jenkins means that I get notified by email as soon as anything breaks.