This is just a quick Public Service Announcement, to let you know that my two main pieces of software have got fancy new websites. Py6S (my Python interface to the 6S Radiative Transfer Model) and RTWTools (my set of extensions for ENVI) are now hosted at:
For those of you interested in the technical details, these websites were manually coded in Sublime Text 2, using the Bootstrap CSS/Javascript framework. As you can see from the screenshots above, they’re basically the same layout, but with different colour schemes. Both sites are very kindly hosted for free by Rackspace, through a wonderful initiative where they provide free Rackspace servers for open-source projects. If you’re interested in getting this hosting for your projects then see here. I’ll be writing another post soon about my experiences using Rackspace through this programme, and the various other things I’m hosting on my Rackspace server.
When dealing with some of the alterations to a journal article today I had the need to batch convert some PDF files to EPS (Encapsulated PostScript). After quite a bit of Googling I came to the conclusion that the only way to do this was to write some Javascript using the Adobe Acrobat API – but actually there is a far easier way. Just follow the instructions below (tested with Adobe Acrobat 9 Pro, but I suspect the same technique will work with other versions).
In summary, what we’re doing is creating a Batch Processing Sequence, but we won’t actually be adding any commands to the sequence, we’ll just be configuring the output options.
Go to the menu Advanced -> Document Processing -> Batch Processing
Click the New Sequence button
Give the sequence a sensible name
You’ll now be in the dialog where you can configure the sequence – and this is where things get slightly counter-intuitive. Rather than selecting any commands at the top of the dialog, ignore everything else and click the Output Options button.
If you just want to save the files with the same filename, but with the appropriate extension for the new filetype then all you need to change is the bit at the very bottom of the dialog. Simply select Export files to alternate format and then choose the format you want from the dropdown box. If you want to do anything fancy with the filename then have a look at the other options: they’re pretty self-explanatory.
Click OK multiple times to get back to the dialog listing all of the sequences.
Select your new sequence in the list and click Run Sequence. You’ll be asked to select the files you want to convert, and then confirm a summary of the sequence (it will be blank as there are no command steps, so just click OK) and then the conversion will be done.
Over the last few months I’ve helped a number of people setup academic websites, and various other people have asked me whether it’s worth a PhD student, Early Career Researcher or other academic creating a website, especially given that it does take a bit of time to do it well. My unequivocal answer is YES!
In emails to these people I’ve given a brief rundown of what websites I have created, what content they have, and – most importantly – what ‘good things’ have resulted from having these websites. Again, using one of Matt Might’s tips for academic blogging, I thought I’d ‘Reply to Public’ by just posting it as a blog post and pointing people here. So, here goes…
Summary: My various websites have been very useful to me. They get my name out there, and have got me paid work (contracting for various people during my PhD), as well as a huge range of opportunities.
I run three main websites: my main academic website, my blog, and my FreeGISData site. First off, these aren’t wonderful, and there are a lot of things that can be improved (particularly the design), but it’s the principle which is important. So, let’s look at those in turn:
This is my ‘academic homepage’ and the link that I put on my business card and give out to people in email signatures etc. It has the standard ‘About Me’ stuff talking about what field I work in, what my research is about, and provides links to my various other sites. One key part of the site is the individual pages for pieces of software that I’ve written, such as Py6S, AutoZotBib and RTWTools, providing brief explanations and links to download them. Again, these are the links that I give out to people who are interested in my software (note that they are simple links that make sense – for example, http://www.rtwilson.com/academic/py6s – it goes where it says on the tin!).
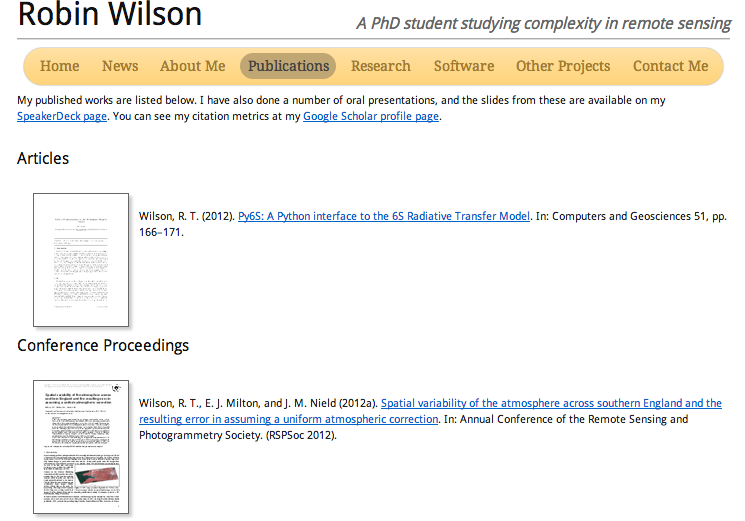
A key page for any academic’s website is the publications list, shown above. Mine uses a graphical approach, breaking up the boring line of text with thumbnails of the first pages of the articles, which works particularly well for my conference posters:
Importantly, each paper/poster is linked to a full PDF and – even more importantly – the page has metadata in it allowing the papers on the page to be automatically added to citation managers such as Zotero and Mendeley. This was actually harder to do than I thought it would be, so I wrote a Python module to do it all for you – bib2coins. It takes a list of publications formatted as a BibTeX file and converts them to the COinS metadata that the citation managers can understand. I’ve now got a fully automated system that will allow me to add a new publication to my BibTeX file and will then automatically update my CV and the publications page and upload both to my website (hopefully I’ll get chance to blog how that works).
That reminds me of the other important item on an academic website: a full academic CV. You never know when someone might want to employ you – possibly as a temporary contractor – and the CV will help.
I post various short articles on my blog, in categories such as Academic, Computing, How To, My Software, Programming, and Reviews. There is a huge range of things on here – from instructions on how to fix network printer problems in Windows 7 (which are now referred to by Microsoft’s own support site) to reviews of academic and non-academic books, along with some more academic posts (such as information about my publications and the software I’ve released).
I don’t post on a regular schedule – I just post when I feel I have something interesting and useful to say. In fact, I have quite a few draft posts and ideas for posts that I haven’t found time to turn in to full posts yet. Overall it doesn’t take a huge amount of time, but quite a few people visit the blog and find it useful.
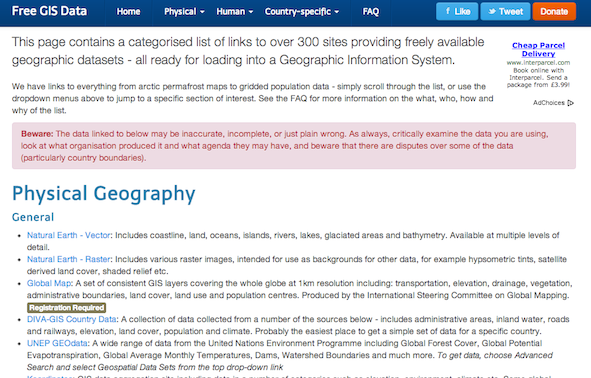
This is my simplest site – it is just a long list of links – but my most popular.
I started collecting a set of links to freely available GIS datasets (land cover, climate – all sorts of things) early in my PhD, and then decided that rather than just keeping the list on my computer, I’d put it on the web so that other people can use it. Other people really liked it, and I started to search for other datasets to add to the list. Loads of people have contacted me to suggest more datasets to add to the list – and there are now over 400 links there, in a huge range of categories.
Visitor Statistics
Overall the websites get a fair number of visitors – not absolutely huge, but not too bad either. Approximate average and maximum monthly visits for each of the sites are listed below:
Site
Average Monthly Visits
Maximum Monthly Visits
Academic
500
900
Blog
3,500
6,500
Free GIS Data
8,000
14,000
Results
This is the key bit: things that have happened because of my website. The general gist is that it has been really helpful, and has led to money, jobs, and free stuff – amongst other things. So, on with the list:
Jobs: Directly through one of my blog posts, I’ve been contracted to do some processing of Landsat footprint shapefiles by some people in the US. The link to my website on my business card also helped me get some work with a university in London for a few weeks, which was very beneficial for me.
Contacts: A huge range of people have contacted me because of my websites and blog posts – people at universities, in industry, the press, and larger organisations. I’ve had the UN contact me to ask whether it was ok to put my Free GIS Data list in a collection of useful sites to acquire data for disaster management (funnily enough, I said yes!), and I’ve been invited to do a keynote speech at a conference in Florida about the importance of freely available geographic data (although sadly this then fell through due to budget cuts at their organisation).
Press: My work on John Snow’s cholera map was featured in the Guardian datablog purely because they found me on Google (my university press office later put out a press release), and this got featured on loads of other blogs, and I was interviewed on local radio.
Free books: After reviewing a couple of books that I’d bought with my own money, I was contacted by a publisher and asked to review one of their books. This continued, and I have now reviewed books from three or four publishers – and one of these reviews was even published in a journal.
Money: I have a ‘donate’ link on my Free GIS Data site. It doesn’t get much at all, but every so often someone donates a fiver. I also have a couple of (small) ads on my blog and my Free GIS Data site, run through the Google AdSense platform. So far I’ve made about £50 from these ads – not much, but enough to cover the hosting costs (or buy myself some nice treats!).
I’m sure there are many more good things that have happened (when my wife reads this she will probably remind me of some that I’ve forgotten) – but even just the ones above were well worth the cost of setting up the sites!
As academics, we’re always told to do a literature review at the beginning of a research project (indeed, a literature review for a PhD may take many months) – but what about doing a data review?
Whether you write it up formally (like a literature review) or not, I think it is important to sit down at the start of a research project and carefully look into what data is available for you to work with. I didn’t do this for my PhD, but I think it would have saved me a lot of trouble if I’d done this right at the beginning.
So, how should you go about a data review? Well, the key thing is to carefully think about what data you will need, and then look into whether any of that data is already available, or whether you will have to create the datasets yourself. Obviously the sort of data you require will vary significantly based on the project – as will the availability of the data – but once you’ve found some possible sources you should be asking yourself these sort of questions:
Can I get access to the data? Does it cost money? Will I need to apply for access? If so, then apply now because it will probably take a while for you to be approved.
Does it come with the metadata I need? I got bitten by this very recently when I used a large dataset that didn’t have all of the associated metadata with it that I needed. I then had to switch datasources towards the end of the project – wasting a lot of time and effort.
Can I load and process the data? What format is it in? Do I have software that can read the format, or will I have to write my own code to process it?
Is the data reliable and accurate? Hopefully there will be some sort of accuracy assessment accompanying the dataset, but even if there isn’t, you should do some assessment of the quality of the data.
Do I understand how the data was acquired/generated, and is this acceptable for what I want to use it for? This is one of the more complicated ones, and requires reading significantly into how the data was made (in the associated paper, report or documentation – which will hopefully exist!) and checking that it is actually valid to use it in your situation. Again, I’ve been bitten by this before, which wasted time and energy.
Exactly how you do the review is up to you. If I ever have PhD students of my own I’d be tempted to ask them do a formal written data review as part of their Literature Review chapter, but it’s equally acceptable just to consider these questions informally – just try and be as exhaustive as possible in your searching, if you start generating datasets that you could have just downloaded then you’ll really feel silly.
I’m sure there are more questions you should ask – some of them will depend on the field (I can think of all sorts of questions for satellite data), but some will be more generic. If you think of any more then please leave a comment and let me know!
I must say that I’m not a huge fan of much of the ArcGIS interface – and I particularly dislike the many levels of nested dialog that you have to use to change various options while creating printed maps. Some of the worst of these are the dialogs for inserting, styling and configuring legends – it nearly always takes me about twenty minutes a nice looking legend – and even then it doesn’t look quite like I want it to.
Anyway, today I’ve found a slightly easier way to do this, which I wanted to share with you.
After inserting a legend, if you open the properties dialog you’ll be shown this wonderfully-designed configuration interface, listing all of the layers shown in the legend:
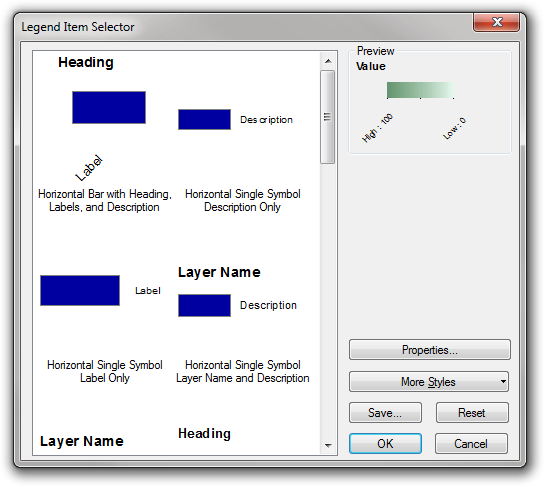
Selecting a layer and clicking the Style button shows you a list of legend styles to choose from:
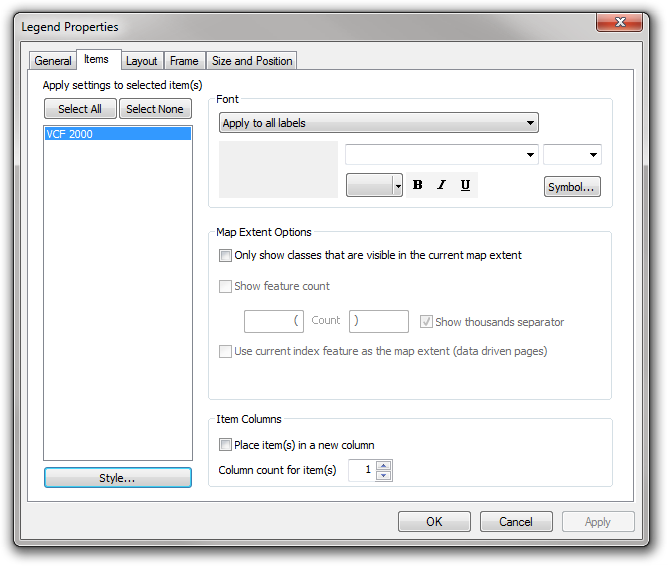
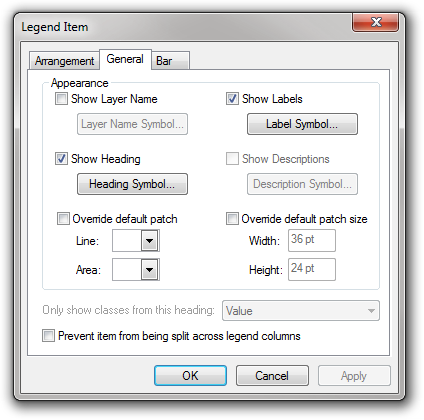
I assumed that you had to use one of these styles, and if you didn’t like the options then tough! But, I’ve found a way to configure the styles…just click the properties button and you’ll find a dialog with three tabs, with useful options on all of the tabs. One of the things that I often want to do is turn off some of the text that isn’t appropriate for this layer (eg. labels, layer names etc), and this can be done in the first tab by simply ticking or unticking the relevant options:
The Bar tab contains a couple of very simple options which allow you to choose the angle of text under raster colour ramp bars – I often find the angled text rather difficult to read, so I tend to set both of these to zero degrees.
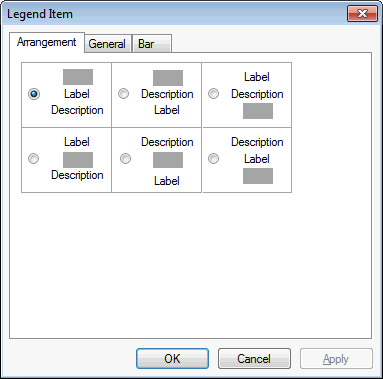
The Arrangement tab provides options to choose how to display the descriptions, labels and headers around the actual symbols and colours themselves:
Unfortunately I can’t seem to get into this Properties dialog box properties when I have more than one layer selected in the first dialog but – and this is something else I didn’t realise – you can save a style that you’ve created so that you can easily use it again: just use the save button in the second dialog box:
I’ve been using ArcGIS for over five years now and had never realised this was possible – so hopefully this will help some other people get slightly less frustrated with ArcGIS! If I helped you then please leave a comment below and let me know.
Summary: Put a plaintext file named CITATION in the root directory of your code, and put information in it about how to cite your software. Go on, do it now – it’ll only take two minutes!
Software is very important in science – but good software takes time and effort that could be used to do other work instead. I believe that it is important to do this work – but to make it worthwhile, people need to get credit for their work, and in academia that means citations. However, it is often very difficult to find out how to cite a piece of software – sometimes it is hidden away somewhere in the manual or on the web-page, but often it requires sending an email to the author asking them how they want it cited. The effort that this requires means that many people don’t bother to cite the software they use, and thus the authors don’t get the credit that they need. We need to change this,so that software – which underlies a huge amount of important scientific work – gets the recognition it deserves.
As with many things relating to software sustainability in science, the R project does this very well: if you want to find out how to cite the R software itself you simply run the command:
citation()
If you want to find out how to cite a package you simply run:
citation(PROJECTNAME)
For example:
> citation('ggplot2')

To cite ggplot2 in publications, please use:

  H. Wickham. ggplot2: elegant graphics for data analysis. Springer New York,
  2009.

A BibTeX entry for LaTeX users is

  @Book{,
    author = {Hadley Wickham},
    title = {ggplot2: elegant graphics for data analysis},
    publisher = {Springer New York},
    year = {2009},
    isbn = {978-0-387-98140-6},
    url = {http://had.co.nz/ggplot2/book},
  }
In this case the citation was given by the author of the package, in R code, in a file called (surprise, surprise) CITATION inside the package directory. R can even intelligently make up a citation if the author hasn’t provided one (and will intelligently do this far better if you use the person class in your description). Note also that the function provides a nice handy BibTeX entry for those who use LaTeX – making it even easier to use the citation, and thus reducing the effort involved in citing software properly.
I think the R approach is wonderful, but the exact methods are rather specific to R (it is all based around a citEntry object or a bibentry object and the CITATION file contains actual R code). That’s fine for R code, but what about Python code, Ruby code, C code, Perl code and so on… I’d like to suggest a simpler, slightly more flexible approach for use broadly across scientific software:
Create a CITATION file in the root directory of your project and put something in there that tells people how to cite it
In most cases this will probably be some plain-text which gives the citation, and possibly a BibTeX entry for it, but it could be some sort of code (in the language your project uses) which will print out an appropriate citation when run (and, of course, R users should stick to the standard way of writing CITATION files for R packages – this proposal is really for users of other languages). This CITATION file will be one of a number of ALL CAPITALS files in your project’s directory – it will go alongside your README file (you do have one, don’t you?), and your LICENCE file (youmust have one – see my explanation for why)and possibly also your INSTALL file and so on.
I know this approach isn’t perfect (machine-readability of citations is a problem using this method, but then again machine readability of citations is a big problem generally…) but I think it is a start and hopefully it’ll reduce the effort required to cite software, and thus encourage software citation.
So, go on – go and write a few CITATION files now!
Summary: When you use the Pixel Locator or Cursor Location/Value tool in ENVI, the latitude and longitude co-ordinates given are based on the datum that the image is in, not necessarily WGS-84.
This may be obvious to some people, but it wasn’t to me – and I thought that if I got confused then some other people probably would too – hence this article. I often use the Pixel Locator dialog box in ENVI to find a specific location in the image by entering the X and Y pixel location (referred to in ENVI as Samples and Lines) or the map co-ordinates of whatever co-ordinate system the image is projected into (for example, the Ordnance Survey National Grid):
Alternatively, you can click the button with the arrows on it, and enter a location in latitude and longitude:
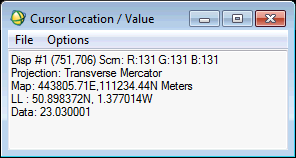
Very handily, all of these values are updated as you move around the image manually – so this dialog can also be used as an equivalent of the Pixel Location/Value window – as shown below.
This all sounds fine – but the problem is that the latitude/longitude values that are shown are calculated using the datum that is defined for the image. You can see this in the image below, where the latitude and longitude value is displayed, and the datum is listed above it:
This seems like a sensible thing to do, but it makes comparison with latitude and longitude co-ordinates from other sources very difficult – as nearly all other latitude and longitude co-ordinates are provided in the WGS-84 datum. Locations from GPS systems are always in WGS-84, and locations on web maps, in GIS systems and most other sources of latitude and longitude co-ordinate systems are very frequently in WGS-84.
So, this raises two questions:
What effect does this have?
Well, I haven’t yet done a full investigation of this (sometime I will sit down and write some code to do some proper testing), but when I found the problem it was causing offsets of around 100-200m – which can be quite significant in many applications.
What can we do about this?
There is a way to tell ENVI to use WGS-84 as the datum for calculating its latitude and longitude values, but it is a bit fiddly. Basically, when you’re in the Pixel Locator dialog before you switch to the latitude/longitude display, click the Change Proj… button and then select click the Datum button to select a new datum. Then switch to the latitude/longitude display, and you’ll find that the datum is listed as WGS-84, and the values will be correct in the WGS-84 datum:
Unfortunately, this means that the map co-ordinate values (for example, the Ordnance Survey Grid References) will now be wrong, and you’ll need to switch back to the original datum to get those to be correct. Also, I can’t find a way to get the Cursor Location/Value dialog to display WGS-84 latitudes and longitudes.
I actually found this while designing a lecture and practical session for MSc students at the University of Southampton on using the ENVI API in IDL. While writing a code example for the students on finding the pixel value at a specific lat/lon co-ordinate, I found that my results came up between ten and twenty pixels away from the place I thought they would (I was using 10m SPOT imagery), and I got different results from my IDL code and ENVI – even though my IDL code was using the ENVI API! Luckily I managed to find out what the problem was – and could therefore explain it to my students, and hopefully stop them running in to the same problem as me. It may be that I’m being silly here, and everyone naturally realises what ENVI does, and thinks it is the right thing to do – but it definitely confused me, so maybe it will helped you.
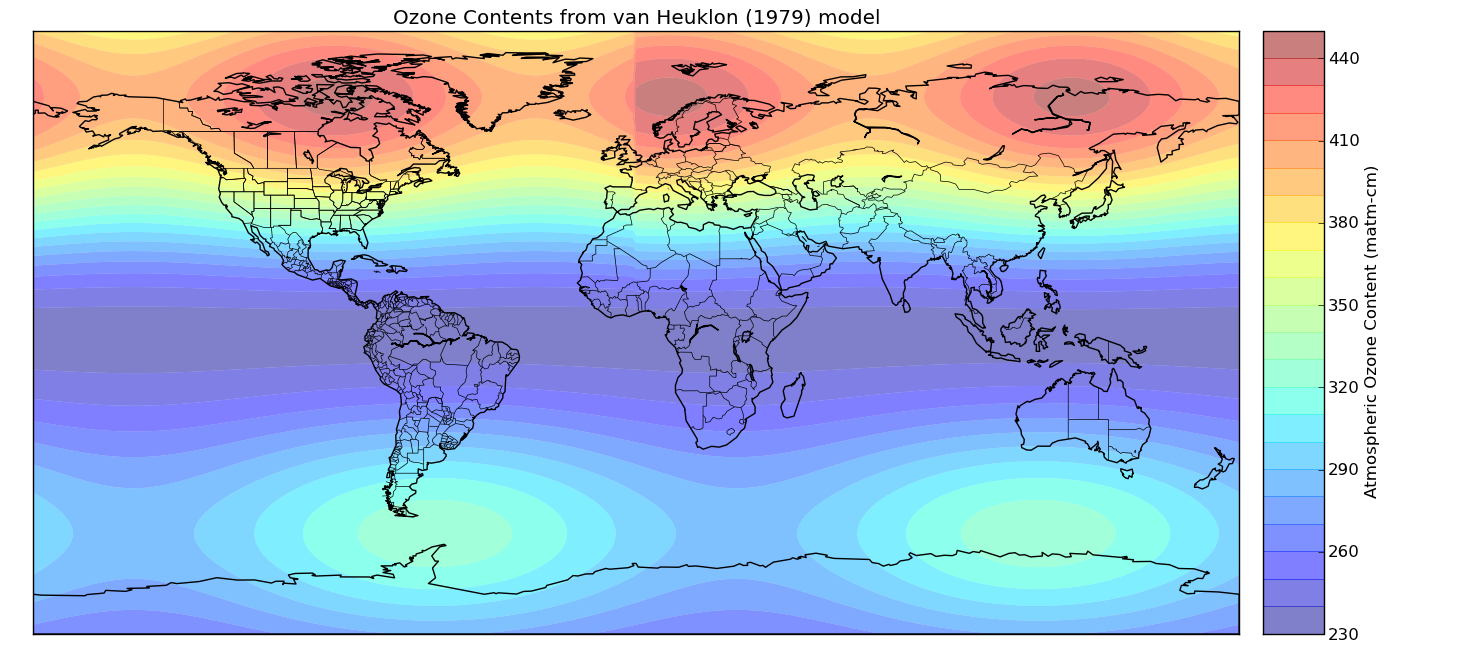
As part of my PhD I wanted to use a simple model which would give me an estimation of the atmospheric ozone amount given a location and time of year. A simple model to do this was created by van Heuklon in 1979, and was described in a delightfully simple paper (unfortunately not freely available online, but see the reference below) using a simple formula. The map below shows the modelled ozone amounts across the world for 15th April (click to enlarge):
The formula was built up from a baseline ozone amount (235 matm-cm) which then has various components added to it, some of which varied based upon latitude, longitude or time of year. The model isn’t intended to be accurate or high-resolution, but provides me with a rough estimate of the ozone amount at a given location at a given time. Accurate measurements of ozone amounts are available from satellites, but I would need to get data from many different times of year to be able to take into account the seasonal variation in ozone amounts, and the satellite data would take up a lot of space – hence using this simple model.
The code for this model is available on Github and has two implementations: get_ozone_conc and old_get_ozone_conc. The latter uses standard Python code with if statements to set the different values in the formula depending on the input latitudes and longitudes, which means it can only process one latitude/longitude combination at once. get_ozone_conc, on the other hand, uses somewhat more complicated numpy code which allows you to pass it arrays of latitudes and longitudes and it will return an array of results. This is what was used to produce the map above – the code for which is also in the repository.
This code was created for use as part of my PhD, but has been released into the public domain (as CC0) in case anyone else finds it useful.
Also, for those of you using Py6S (my Python interface to the 6S atmospheric Radiative Transfer Model), I’m sure you will be pleased to know that this model will shortly be integrated into Py6S to allow you to easily specify ozone amounts using it.
References:
van Heuklon, T. K. (1979). Estimating atmospheric ozone for solar radiation models. Solar Energy, 22(1), 63-68
Another one of the things that came out of the Collaborations Workshop 2013 was the importance of licensing any software or code that you release. The whole point of releasing code is so that other people can use it – but no-one can use it properly unless you tell them what license you have released it under.
I’ve run into various problems with un-licensed code during the last few years, which makes it all the more embarrassing that I didn’t have proper licenses specified for all of my GitHub repositories – I didn’t even have proper licenses specified for some of the packages that I have released on the Python Package Index!
Anyway, I’ve been through and set licenses for all of my repositories, and I’ve explained the procedure I went through for each repository below, which consists of two simple steps:
Choose a license – this is the thing that often scares people, and it can be fairly difficult. Unfortunately most of the guidestochoosingopen-sourcelicenses online are fairly complicated, and unfortunately not much can be done about that, because some of the licenses themselves are fairly complicated. There are a few key things to keep in mind:
Make sure that any license you choose is OSI-approved, or it won’t properly count as ‘open source’
Think about whether you want to force everyone who uses your code to release anything they use it in as open-source (as in the GPL), any modifications they make to it as open-source (as in the LGPL), or whether people can do whatever they want with it.
Think about whether you want to let anyone – including yourself – use the code in commercial software. If so, depending on your views on the previous question, you may want to release under a license like LGPL or BSD rather than releasing under the GPL which would mean the code could never be used commercially.
Do you just really not care what happens to the code – anyone can do anything they want, in any way they want, and don’t have to bear you in mind in the slightest? If so, formally releasing the code into the public domain through something like CC0 may be a good way to go – although I wouldn’t recommend this for large bits of code/software as it is not specifically designed with software in mind – it is more appropriate for small code samples and examples.
Tell people what the license is – in as many places as possible – now you’ve gone to the trouble of choosing a license you want people to be able to easily find out what license the code is released under. To achieve that, do as many of the items below as possible (ordered roughly in order of importance):
Place a license file in your source directory with a filename of LICENSE or COPYING (depending on the license – generally GPL-style licenses ask you to use a file called COPYING, whereas many other licenses suggest a file called LICENSE). Put a full ASCII text copy of the license into this file.
State in the README file (you do have a README file, don’t you?) what license the code is released under.
State in the documentation (preferably somewhere fairly obvious, such as above the Table of Contents, or on the Introduction page) what license the code is released under.
Add headers to the top of your source code files stating the license that the code is released under, and the author(s). Many licenses provide a suggested short version of the license to put here, but if not, just write a simple comment stating the license and telling readers to look in the LICENSE or COPYING file for more details.
If your code has been uploaded to some sort of package repository, such as CRAN, CPAN, the Python Package Index or Rubygems then see if there is some metadata you can fill in to say what license you are using – as this will mean people can search for your software by the type of license it uses (for example, if they’re looking to use it commercially). For example, when writing the setup.py file ready to upload a Python module to the Python Package Index you can fill in various categories – known as troves – and a number of these are for licenses, such as License :: OSI Approved :: GNU General Public License (GPL)
That’s it – it really is as simple as that. All you need to do now is to commit your changes to you version control system (you are using version control, aren’t you?) and anyone who finds your code will know what license it is under, and therefore what they are allowed to do with it.
However, there is one more thing to consider: what about example code that you post online (on your blog, on StackOverflow etc) – what should you do about that? I’m not a lawyer, but the consensus seems to be that if there isn’t an explicit license attached to the code then it is very difficult to decide what people are allowed to do with it – they’re almost certainly not allowed to use it commercially, and there may – or may not – be uses that count as ‘fair use’. To save everyone a lot of bother I’ve decided to release all of my small code samples into the public domain as CC0. The way I’ll do this is generally by a link in the text surrounding the sample ("As seen in the following example (released under CC0)") or as a comment at the top of the code. I’ve also taken a number of old Github repositories that I wrote as part of various courses at university (for example, my parallel programming exercises) and released those as CC0, by simply specifying in the README files.
Hopefully this post will have been useful to you – let me know what you think in the comments below. Is the idea to use CC0 for small code samples a good idea? I think so personally, but I’d be interested to hear alternative points of view.
This is a first of a number of posts based upon discussions I had while at the Collaborations Workshop 2013 (#CollabW13 on twitter) in Oxford, UK. During one of the sessions I described a simple technique that I try and use to increase the sustainability, reproducibility and releasability of code that I write, data I collect and the results of my work – and people thought this idea was great, and that I should blog about it…
So, what is this wonderful technique:
On Friday afternoon (when you’re bored and can’t be bothered to do any hard work…) spend an hour or two cleaning up and documenting your work from that week
It’s a very simple idea, but it really does work – and it also gives you something to do during the last afternoon of the week when you’re feeling tired and can’t really be bothered. If you can’t commit to doing it every week, you can try every fortnight or month – and I even go as far as adding it as an event to my calendar, to try and stop people arranging meetings with me then!
So, what sort of things can you do during this time?
Document your code: Depending on the project and the intended use of the documentation, this can be anything from adding some better comments to your code, to documenting individual functions/methods (for example, using docstrings in Python) or writing high-level documentation of the whole system.
Refactor your code: Refactoring is a “disciplined technique for restructuring an existing body of code, altering its internal structure without changing its external behaviour” – that is, basically tidying up, cleaning up, and possibly redesigning you’re code. If you’re anything like me, the code you write when actually doing science isn’t very neat, nice or well-designed – because you’re focused on the science at that point. These few hours on a Friday are your time to focus on the code for a bit…
Generalise your code to create a library: There are probably a number of things in your code that could be used in many other programs – things like reading certain file formats, performing statistical operations or applying algorithms to array data. This is a perfect time to take these algorithms and ‘decouple’ them from their immediate application in this code so that they can be easily used in other programs you may write in the future. Ideally, this generalised functionality can be packaged into a library and distributed for others to use. My Py6S library was created in this way: I took code that I was using to run the 6S model, generalised it into a library, documented it well, released it – and it has taken on a life of its own!
Add README files to your folders: If you’re anything like me, you’ll have loads of folders containing data and code – some of which isn’t particularly well named and may not have metadata. One of the easiest (and most effective) ways to deal with this is to create simple README files in each folder explaining what is in the folder, where it came from, what format it’s in – basically anything that you think you’ll want to know about it in a year’s time if you come back to it. I can say from experience just how useful having these README files is!
The key benefit of all of these is that it makes it so much easier to come back to your research later on, and it also makes it so much easier for you to share your research, make it reproducible and allow others to build upon it – and the great thing is that it doesn’t even take that much work. Thirty seconds writing a few notes in a README file could easily save you a week of work in a year’s time, and extending your code into a library would allow you to re-use it in other projects without much extra work.
Another similar idea that was mentioned by someone else at the Collaborations Workshop was for Research Councils to force people to add extra time to the end of their grants to do this sort of thing – although personally, I think it is a far better idea to do this as you go along. Trying to add documentation to some code that you wrote two years ago is often quite challenging…
So, there it is – a simple way to use up some time at the end of the week (when you can’t really be bothered to do anything ‘new’) which will significantly improve the sustainability, reproducibility and releasability of your code and data. Try it out, and let us know how you do in the comments below!